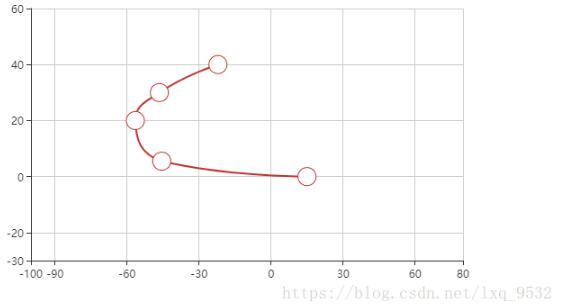
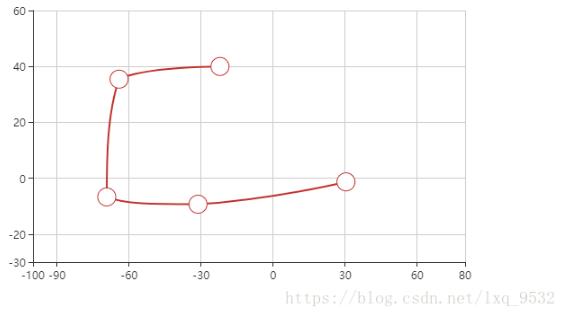
使用echarts实现折线图的拖拽,供大家参考,具体内容如下
<!DOCTYPE html>
<html>
<head>
 <meta charset="utf-8">
 <script src="./echarts.js"></script>
</head>
<body>
 <div id="main" style="width: 600px;height:400px;"></div>
 <script type="text/javascript">
 var symbolSize = 20;
 var data = [[15, 0], [-50, 10], [-56.5, 20], [-46.5, 30], [-22.1, 40]];
 var myChart = echarts.init(document.getElementById('main'));
 myChart.setOption({
 # 表示不使用默认的『显示』『隐藏』触发规则。
  tooltip: {
   triggerOn: 'none',
   formatter: function (params) {
    return 'X: ' + params.data[0].toFixed(2) + '<br>Y: ' + params.data[1].toFixed(2);
   }
  },
  xAxis: {
   min: -100,
   max: 80,
   type: 'value',
   axisLine: {onZero: false}
  },
  yAxis: {
   min: -30,
   max: 60,
   type: 'value',
   axisLine: {onZero: false}
  },
  series: [
   {
    id: 'a',
    type: 'line',
    smooth: true,
    symbolSize: symbolSize,
    data: data
   }
  ],
 });
 myChart.setOption({
 #拖拽功能:用 graphic 组件,在每个点上面,覆盖一个隐藏的可拖拽的圆点
  graphic: echarts.util.map(data, function (item, dataIndex) {
   return {
    type: 'circle',
    position: myChart.convertToPixel('grid', item),
    shape: {
     r: symbolSize / 2
    },
    invisible: true,
    draggable: true,
    ondrag: echarts.util.curry(onPointDragging, dataIndex),
    onmousemove: echarts.util.curry(showTooltip, dataIndex),
    onmouseout: echarts.util.curry(hideTooltip, dataIndex),
    z: 100
   };
  })
 });
 window.addEventListener('resize', function () {
  myChart.setOption({
   graphic: echarts.util.map(data, function (item, dataIndex) {
    return {
     position: myChart.convertToPixel('grid', item)
    };
   })
  });
 });
 function showTooltip(dataIndex) {
  myChart.dispatchAction({
   type: 'showTip',
   seriesIndex: 0,
   dataIndex: dataIndex
  });
 }
 function hideTooltip(dataIndex) {
  myChart.dispatchAction({
   type: 'hideTip'
  });
 }
 function onPointDragging(dataIndex, dx, dy) {
  data[dataIndex] = myChart.convertFromPixel('grid', this.position);
  myChart.setOption({
   series: [{
    id: 'a',
    data: data
   }]
  });
 }

</script>
</body>
</html>