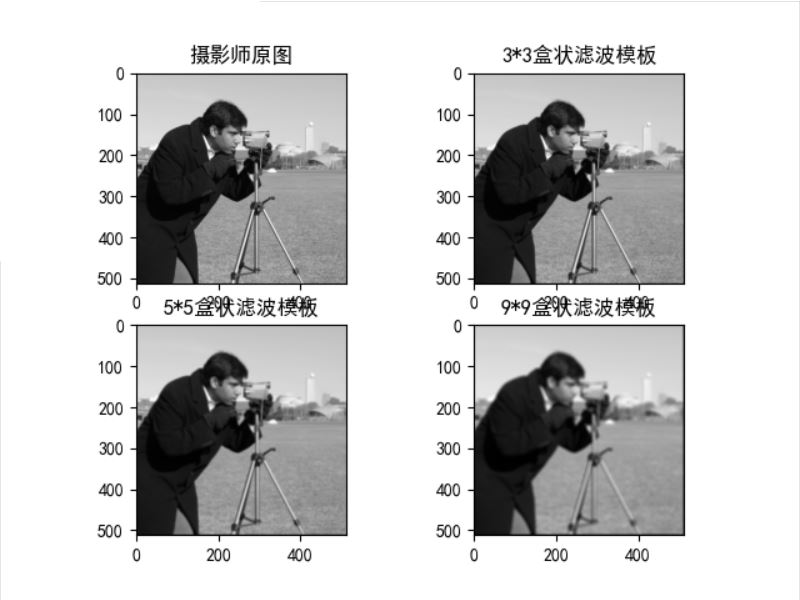
先上图

使用plt.subplots(2,2)绘图时,子图的标题和上图重叠,影响观感:
源代码:
import numpy as np
from scipy import signal
from skimage import data
from matplotlib import pyplot as plt

# 定义二维灰度图像的空间滤波函数
def correl2d(img, window):
	# 使用滤波器实现图像的空间相关
	# mode = 'same'表示输出尺寸等于输入尺寸
	# boundary = 'fill'表示滤波前,用常量值填充原始图像的边缘,默认常量值为0
	s = signal.correlate2d(img, window, mode='same', boundary='fill')
	return s.astype(np.uint8)
# img为原始图像
img = data.camera()
# 3*3盒状滤波模板
window_1 = np.ones((3, 3))/(3 ** 2)
# 5*5盒状滤波模板
window_2 = np.ones((5, 5))/(5 ** 2)
# 9*9盒状滤波模板
window_3 = np.ones((9, 9))/(9 ** 2)
# 生成滤波结果
new_img_1 = correl2d(img, window_1)
new_img_2 = correl2d(img, window_2)
new_img_3 = correl2d(img, window_3)
# 显示图像
plt.rcParams['font.sans-serif'] = ['SimHei'] # 中文
fig, axs = plt.subplots(2, 2)
axs[0, 0].imshow(img, cmap='gray')
axs[0, 0].set_title("摄影师原图")
axs[0, 1].imshow(new_img_1, cmap='gray')
axs[0, 1].set_title("3*3盒状滤波模板")
axs[1, 0].imshow(new_img_2, cmap='gray')
axs[1, 0].set_title("5*5盒状滤波模板")
axs[1, 1].imshow(new_img_3, cmap='gray')
axs[1, 1].set_title("9*9盒状滤波模板")
plt.show()
方法1:在plt.show() 之前添加一句:
plt.tight_layout()
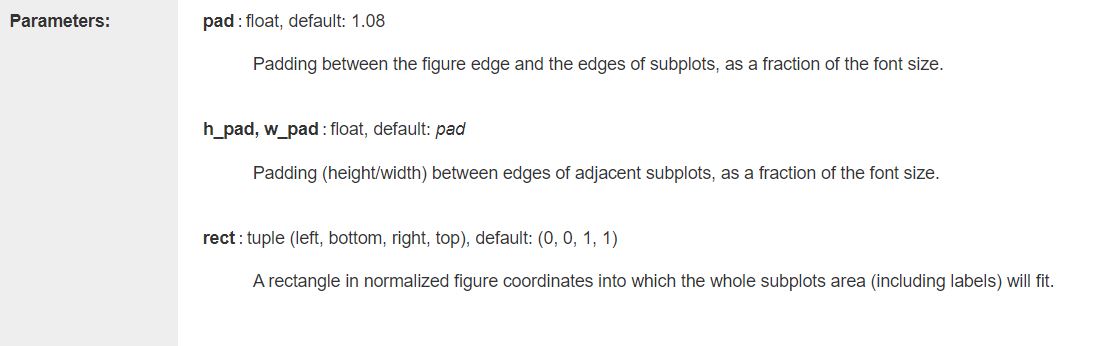
函数原型:
matplotlib.pyplot.tight_layout(*, pad=1.08, h_pad=None, w_pad=None, rect=None)
作用:调整subplots子图见的间距
Adjust the padding between and around subplots.
参数:
部分代码:
# 显示图像
plt.rcParams['font.sans-serif'] = ['SimHei'] # 中文
fig, axs = plt.subplots(2, 2)
axs[0, 0].imshow(img, cmap='gray')
axs[0, 0].set_title("摄影师原图")
axs[0, 1].imshow(new_img_1, cmap='gray')
axs[0, 1].set_title("3*3盒状滤波模板")
axs[1, 0].imshow(new_img_2, cmap='gray')
axs[1, 0].set_title("5*5盒状滤波模板")
axs[1, 1].imshow(new_img_3, cmap='gray')
axs[1, 1].set_title("9*9盒状滤波模板")
plt.tight_layout()
plt.show()
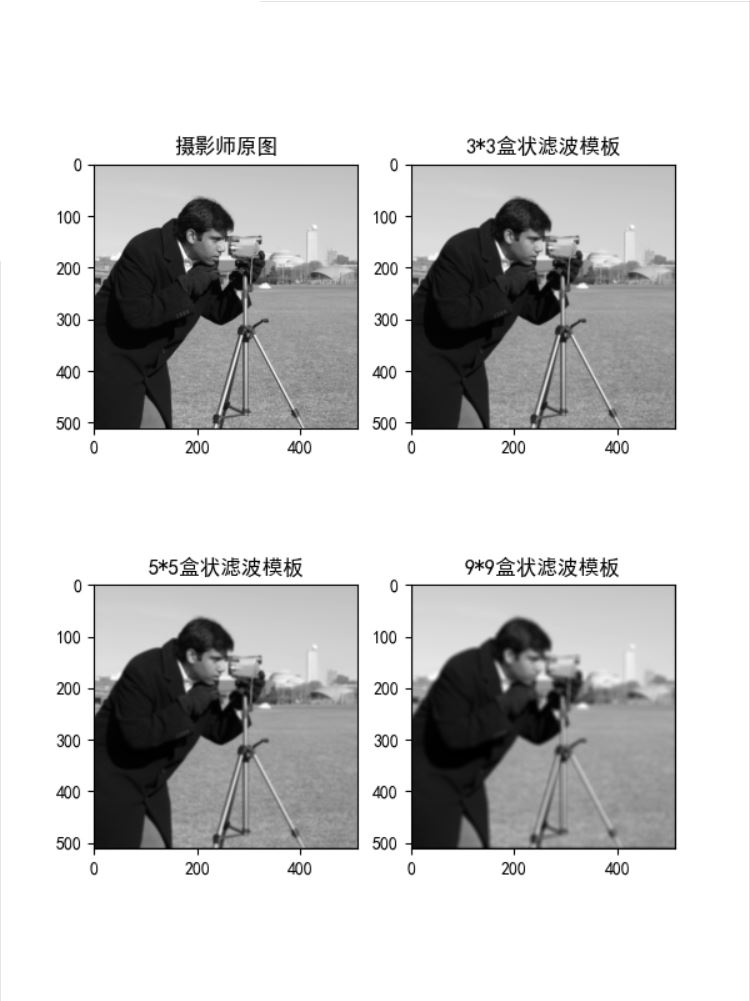
方法1测试结果:
方法2:在subplots中设置figsize
fig, axs = plt.subplots(2, 2,figsize=(6, 15))
# 显示图像
plt.rcParams['font.sans-serif'] = ['SimHei'] # 中文
# 设置figsize,防止图片重叠
fig, axs = plt.subplots(2, 2,figsize=(6, 15))
axs[0, 0].imshow(img, cmap='gray')
axs[0, 0].set_title("摄影师原图")
axs[0, 1].imshow(new_img_1, cmap='gray')
axs[0, 1].set_title("3*3盒状滤波模板")
axs[1, 0].imshow(new_img_2, cmap='gray')
axs[1, 0].set_title("5*5盒状滤波模板")
axs[1, 1].imshow(new_img_3, cmap='gray')
axs[1, 1].set_title("9*9盒状滤波模板")
方法2测试结果:
参考
[1]https://blog.csdn.net/txh3093/article/details/106401484

