在prometheus需要向ngxin中打入探针,通过探针获取ngxin信息,并通过接口输出。下文将讲述如何监控ngxin。
为了各位小伙伴方便,这里提供了一波下载地址,如果模板不是特别满意,也可以去官网自行下载。
nginx:
链接: http://pan.baidu.com/s/1QxcWrxAEARlEhxSb2ZETjQ
提取码: 6fp5
nginx-module-vts-master:
链接: http://pan.baidu.com/s/1gCyAithAlRkORuZwhpcPmA
提取码: h9aa
nginx-vts-exporter
链接: http://pan.baidu.com/s/1gVB_I6ifDbeNIBX5x9pGAA
提取码: upkw
nginx-vts-stats_rev2 (grafana显示模板)
链接: http://pan.baidu.com/s/1VI9V395OemPkf6W-sNL9HQ
提取码: da56
1.解压nginx-vts-exporter
这里nginx是重新安装 ,解压nginx-vts-exporter 这里放在usr/local。
unzip nginx-module-vts-master.zip
这里注意nginx版本有要求否则会报错,以下是nginx对应的版本。
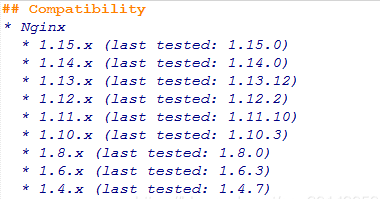
2.解压nginx。
tar -zxvf nginx-1.14.2.tar.gz
3.安装
把nginx-vts-exporter放到nginx路径 ,并执行安装操作。
cd usr/local/nginx-1.14.2
./configure --prefix=/usr/local/nginx --add-module=usr/local/nginx-module-vts-master/
注意:注意prefix=/usr/local/nginx意思是安装位置为/usr/local/nginx文件夹
make install
4.修改conf文件
http {
    vhost_traffic_status_zone;
    vhost_traffic_status_filter_by_host on;

...

server {

    ...

    location /status {
        vhost_traffic_status_display;
        vhost_traffic_status_display_format html;
    }
}
5.启动
cd /usr/local/nginx/sbin
./nginx
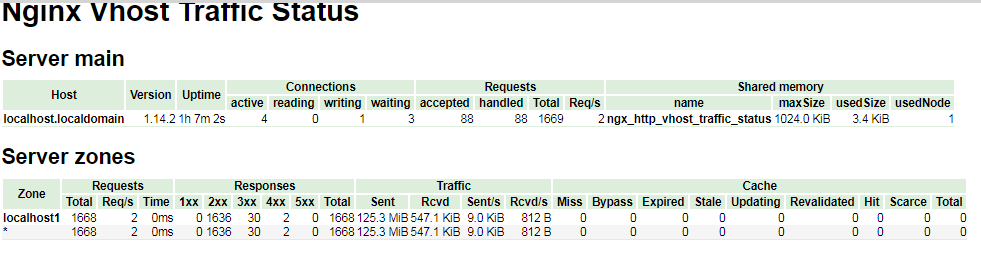
访问http://ip/status出现以下显示则表示nginx与nginx-vts-exporter安装成功。
这里安装包放在usr/local下,解压。
tar -zxvf nginx-vts-exporter-0.9.1.linux-amd64.tar
启动。
cd /usr/local/nginx-vts-exporter-0.9.1.linux-amd64
nohup ./nginx-vts-exporter  -nginx.scrape_uri http://ip/status/format/json &
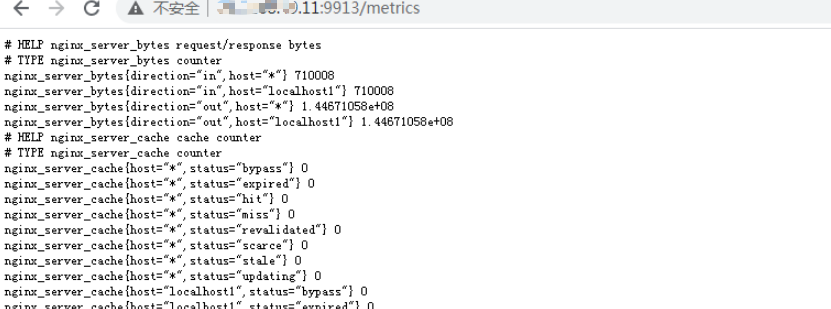
输入http://ip:9913/metrics,如果出现以下证明完成。
修改/usr/local/prometheus-2.17.1.linux-amd64/prometheus.yml。
# my global config
global:
  scrape_interval:     15s # Set the scrape interval to every 15 seconds. Default is every 1 minute.
  evaluation_interval: 15s # Evaluate rules every 15 seconds. The default is every 1 minute.
  # scrape_timeout is set to the global default (10s).

# Alertmanager configuration
alerting:
  alertmanagers:
  - static_configs:
    - targets:
      # - alertmanager:9093

# Load rules once and periodically evaluate them according to the global 'evaluation_interval'.
rule_files:
  # - "first_rules.yml"
  # - "second_rules.yml"

# A scrape configuration containing exactly one endpoint to scrape:
# Here it's Prometheus itself.
scrape_configs:
  # The job name is added as a label `job=<job_name>` to any timeseries scraped from this config.
  - job_name: 'prometheus'
    static_configs:
    - targets: ['localhost:9090']
  - job_name: 'nginx'
    static_configs:
      - targets: ['ip:9913']
出现以下配置成功。

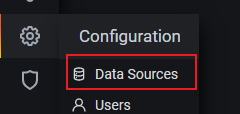
输入grafana可视化页面地址:ip:3000。
1.配置数据源 (prometheus地址:ip:9090)
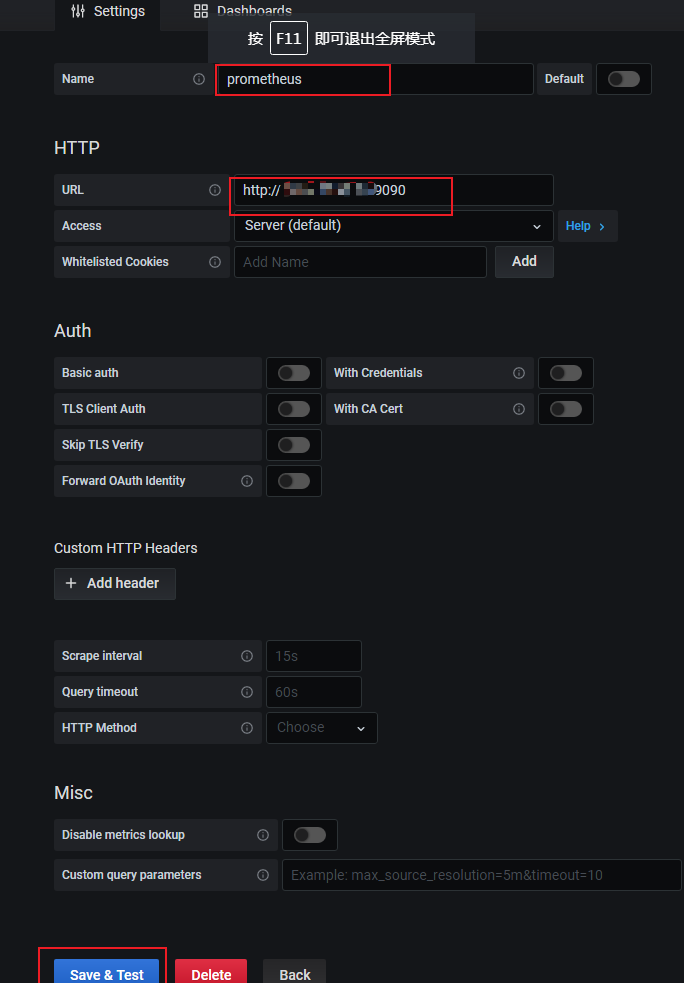
上图填写你prometheus地址,端口切记填写9090,点击save后,如果失败会有提示 。
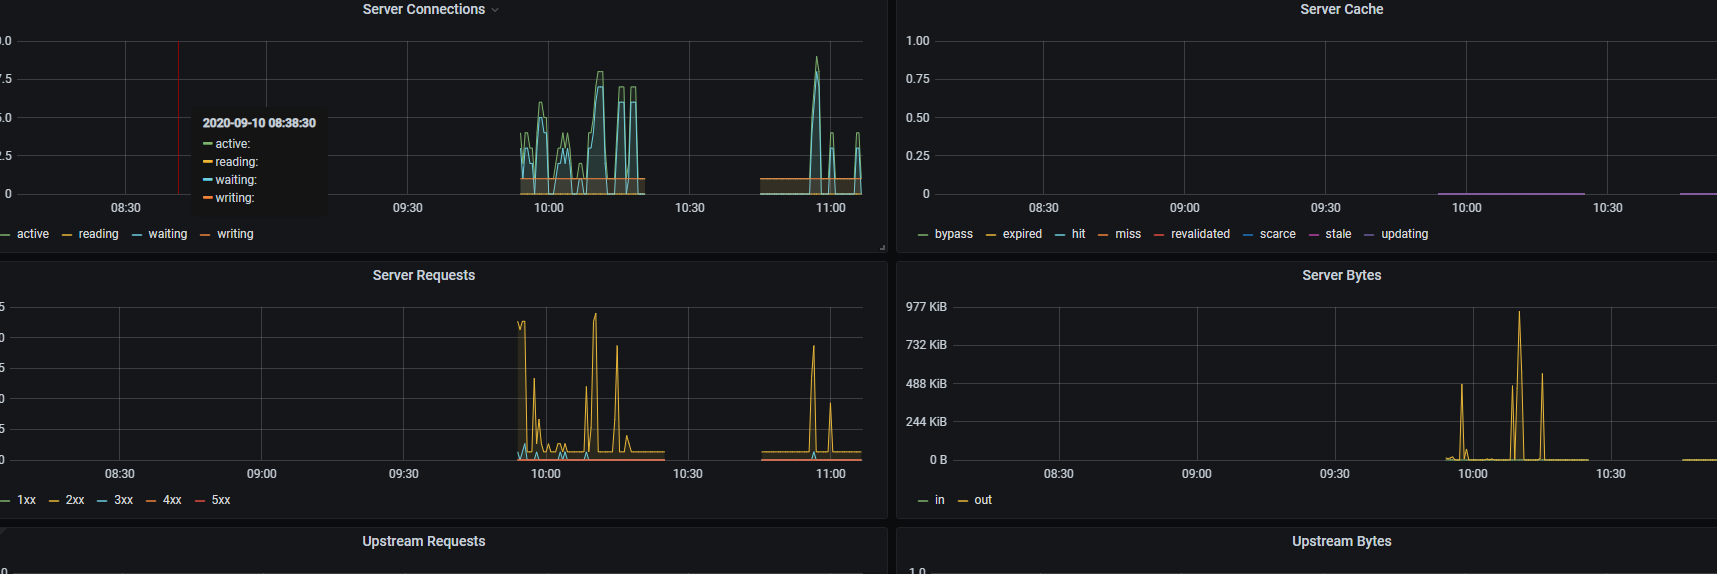
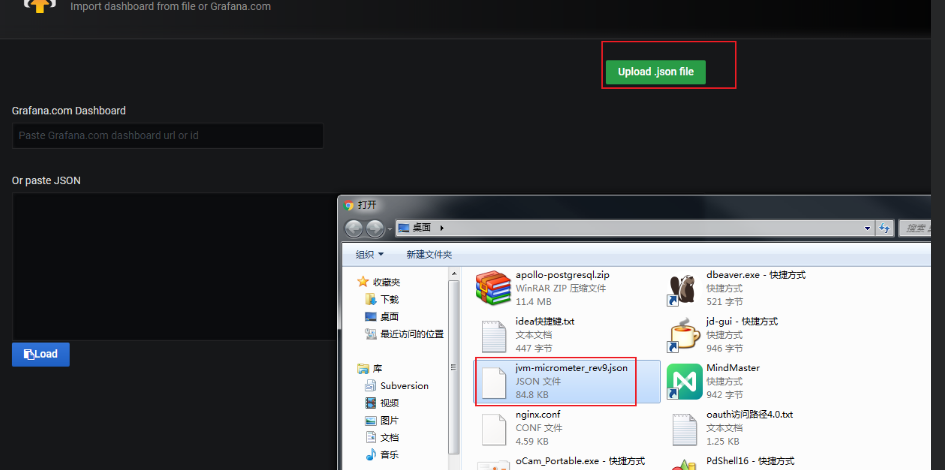
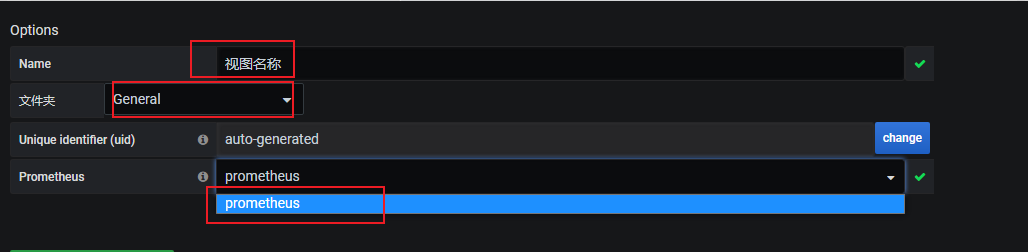
2.可视化界面模板
选择上文配置好的数据源,prometheus选项就是上文配置的数据源。
3.验证
出现以下显示则表示成功。