今天给大家带来的是一个用SpringBoot + thymeleaf显示出饼状图和柱形图
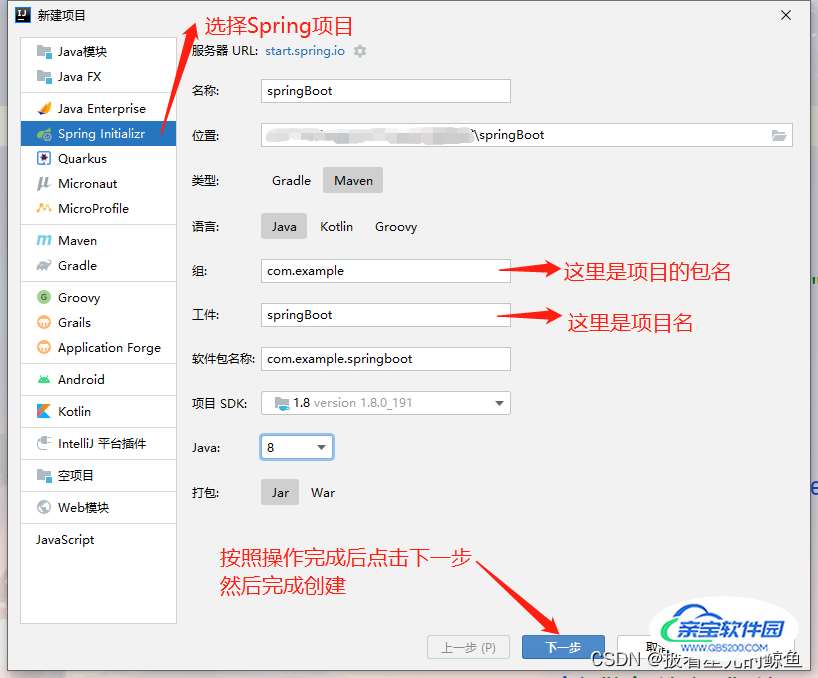
首先我们先创建项目 注意:创建SpringBoot项目时一定要联网不然会报错
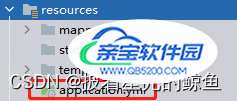
项目创建好后我们首先对 application.yml 进行编译
#指定端口号
server:
port: 8888
#配置mysql数据源
spring:
datasource:
driver-class-name: com.mysql.cj.jdbc.Driver
url: jdbc:mysql://localhost:3306/nba?serverTimezone=Asia/Shanghai
username: root
password: root
#配置模板引擎 thymeleaf
thymeleaf:
mode: HTML5
cache: false
suffix: .html
prefix: classpath:/templates/
mybatis:
mapper-locations: classpath:/mapper/*.xml
type-aliases-package: com.bdqn.springboot #放包名
接下来我们写后端代码
mapper层
package com.bdqn.springbootexcel.mapper;
import com.bdqn.springbootexcel.pojo.User;
import org.apache.ibatis.annotations.Insert;
import org.apache.ibatis.annotations.Mapper;
import org.apache.ibatis.annotations.Select;
import java.util.List;
@Mapper
public interface UserMapper {
    @Select("select * from user")
    List<User> find();
    @Insert("insert into user ( name, age, sex) values ( #{name}, #{age}, #{sex})")
    int add(User user);
}
实体类
package com.bdqn.springbootexcel.pojo;
import com.alibaba.excel.annotation.ExcelProperty;
import lombok.Data;
@Data
public class User {
    @ExcelProperty(index = 0,value = "用户编号")
    private Integer id;
    @ExcelProperty(index = 1,value = "用户姓名")
    private String name;
    @ExcelProperty(index = 2,value = "用户年龄")
    private String age;
    @ExcelProperty(index = 3,value = "用户性别")
    private String sex;
}
现在编写最重要的前端代码
index.html
<!DOCTYPE html>
<html lang="en" xmlns:th="http://www.thymeleaf.org">
<html lang="en">
<head>
<meta charset="UTF-8">
<title>Title</title>
</head>
<body>
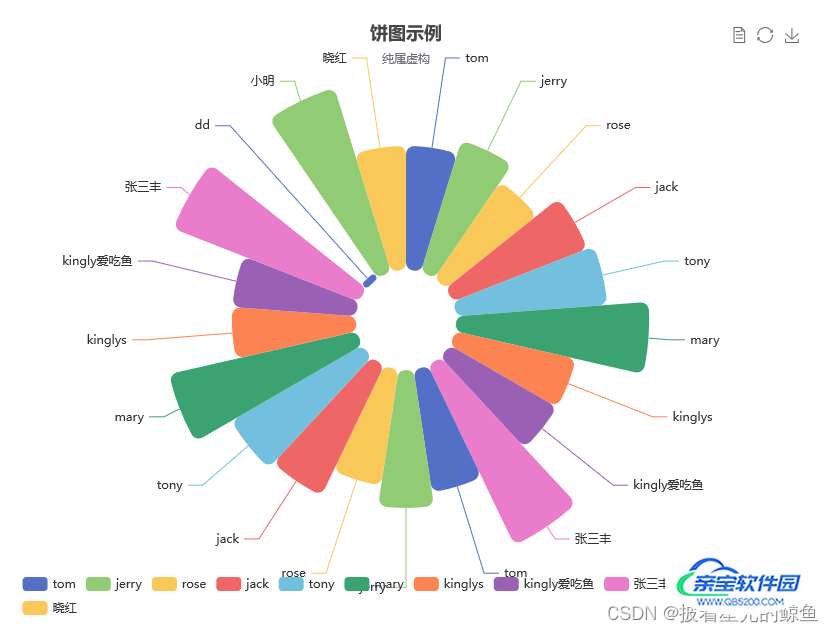
<!--饼状图-->
<div id="pie" style="width:800px;height:600px;"></div>
<script th:src="@{https://cdn.bootcdn.net/ajax/libs/echarts/5.4.0/echarts.min.js}"></script>
<script>
option = {
title: {
text:'饼图示例',
subtext:'纯属虚构',
left:'center'
},
legend: {
top: 'bottom'
},
tooltip:{
trigger:'item'
},
toolbox: {
show: true,
feature: {
mark: { show: true },
dataView: { show: true, readOnly: false },
restore: { show: true },
saveAsImage: { show: true }
}
},
series: [
{
name: 'Nightingale Chart',
type: 'pie',
radius: [50, 250],
center: ['50%', '50%'],
roseType: 'area',
itemStyle: {
borderRadius: 8
},
data: [
]
}
]
};
var chartDom = document.getElementById('pie');
var myChart = echarts.init(chartDom);
fetch("/pojos_bing").then(response => response.json()).then(res => {
res.forEach(item => {
//name 和 age 都是数据库中的值
option.series[0].data.push({name: item.name,value: item.age})
})
myChart.setOption(option);
})
</script>
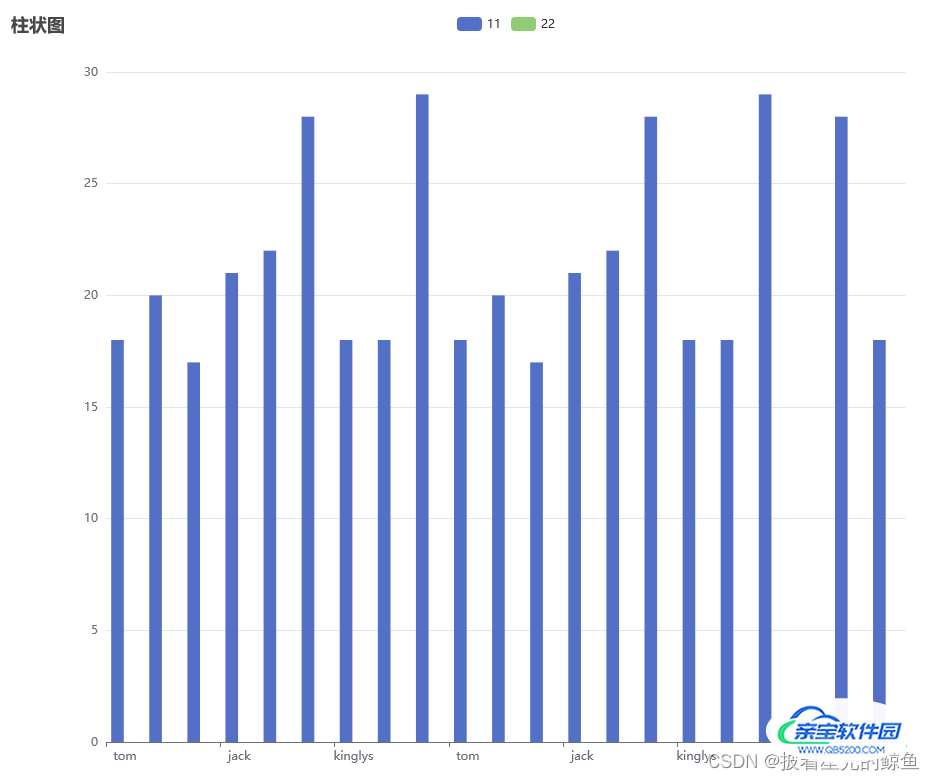
<!--柱状图-->
<div style="height: 50px;"></div>
<div id="bar" style="width: 1000px;height: 800px;"></div>
<script>
barOption = {
title: {
text: '柱状图'
},
legend: {
top: 'top'
},
tooltip: {
trigger: 'axis'
},
xAxis: {
type: 'category',
data: []
},
yAxis: {
type: 'value'
},
series: [
{
name: '11',
data: [],
type: 'bar'
},
{
name: '22',
data: [],
type: 'bar'
}
]
};
var barDom = document.getElementById('bar');
var barChart = echarts.init(barDom);
fetch("/pojos_bing").then(response => response.json()).then(res => {
//name 和 age 都是数据库中的值
const name= res.map(v => v.name);
barOption.xAxis.data = name
const age= res.map(v => v.age);
barOption.series[0].data = age
barChart.setOption(barOption)
})
</script>
</body>
</html>现在我们看看前端展示效果