
众所周知,MATLAB中的colormap只有少得可怜的几种:
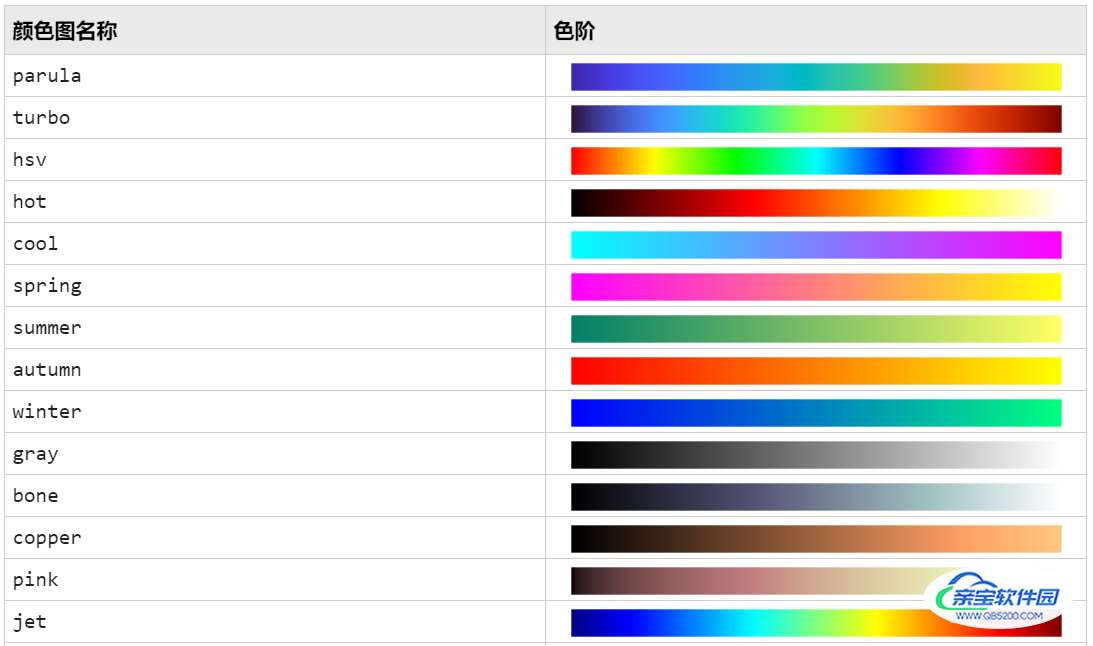
有很多应用在很特殊的图形中的colormap几乎都没有,而每次写代码都要去找颜色的图属实太麻烦,因此就有了开发集成包的想法,我之前出过一篇使用python全部配色的文章,但是代码写的比较飘导致老版本用不了,这次使用了比较基础的代码和调用方式,争取能让更多人能用上。
matplotlab颜色新增了一些,但这哪够,于是我将:
包全部集成了进来,终于有了这套包含200个colormap的工具函数slanCM
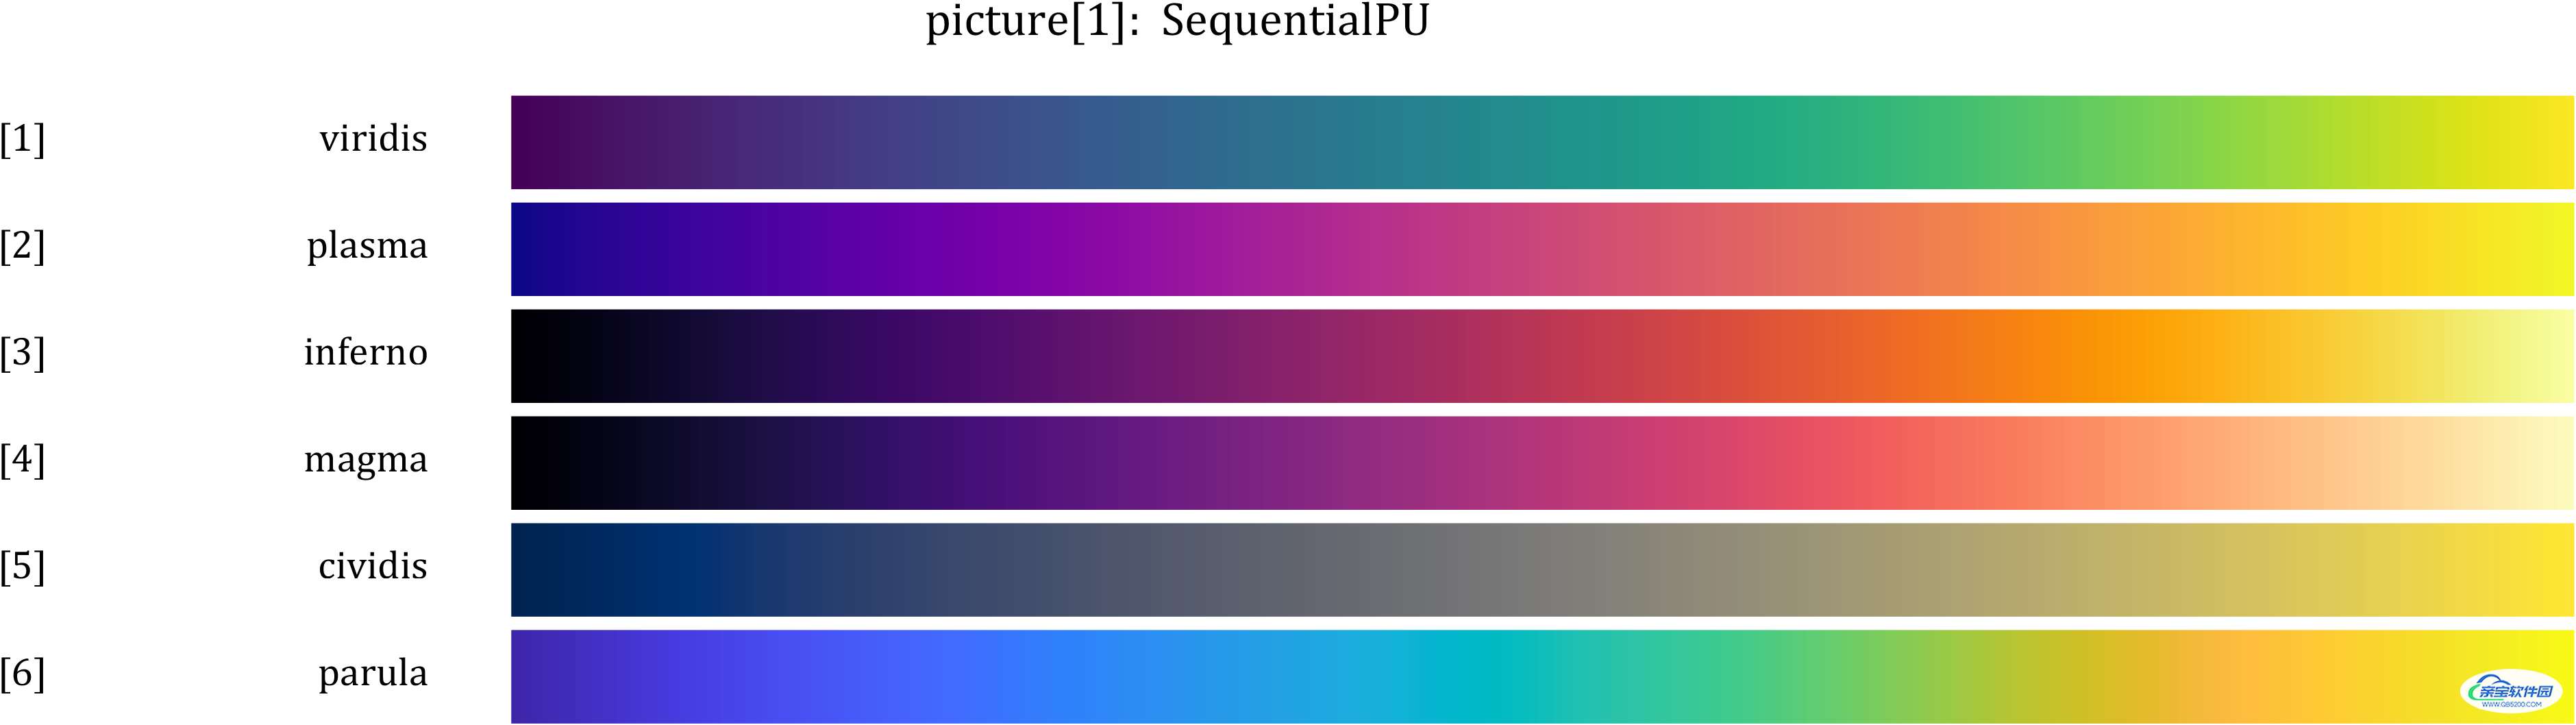
Perceptually Uniform Sequential 感知一致 colormap:

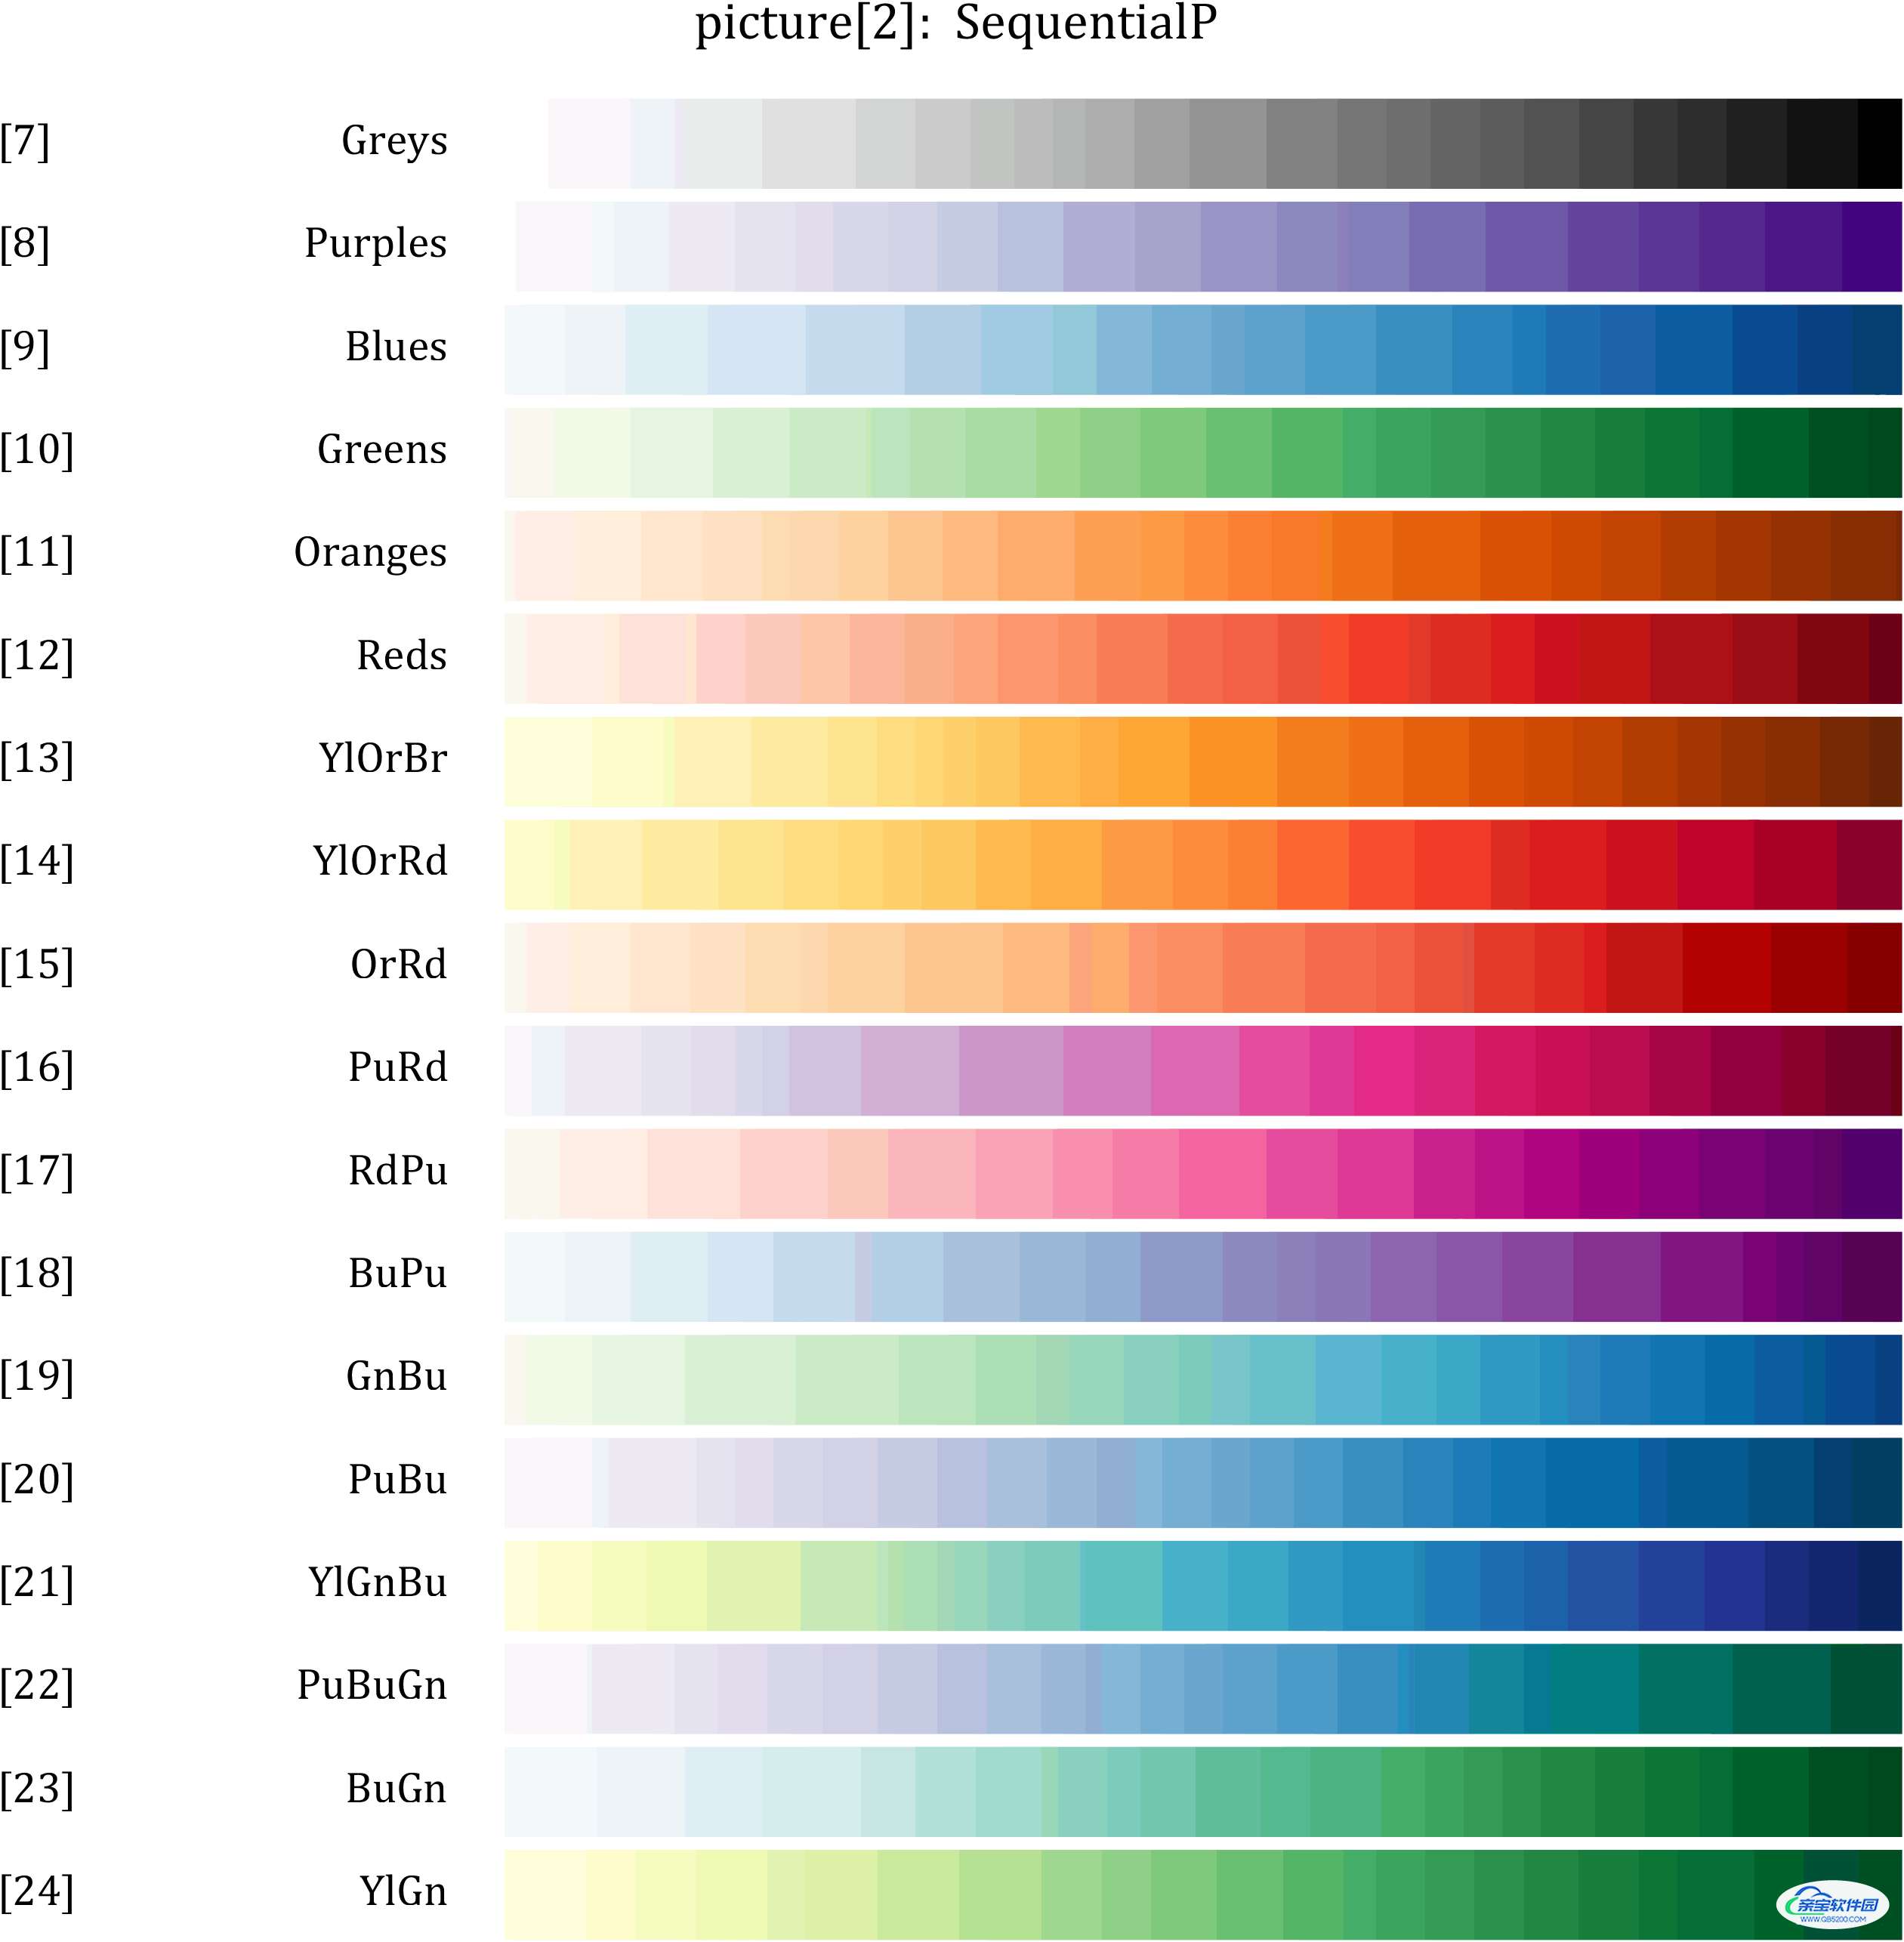
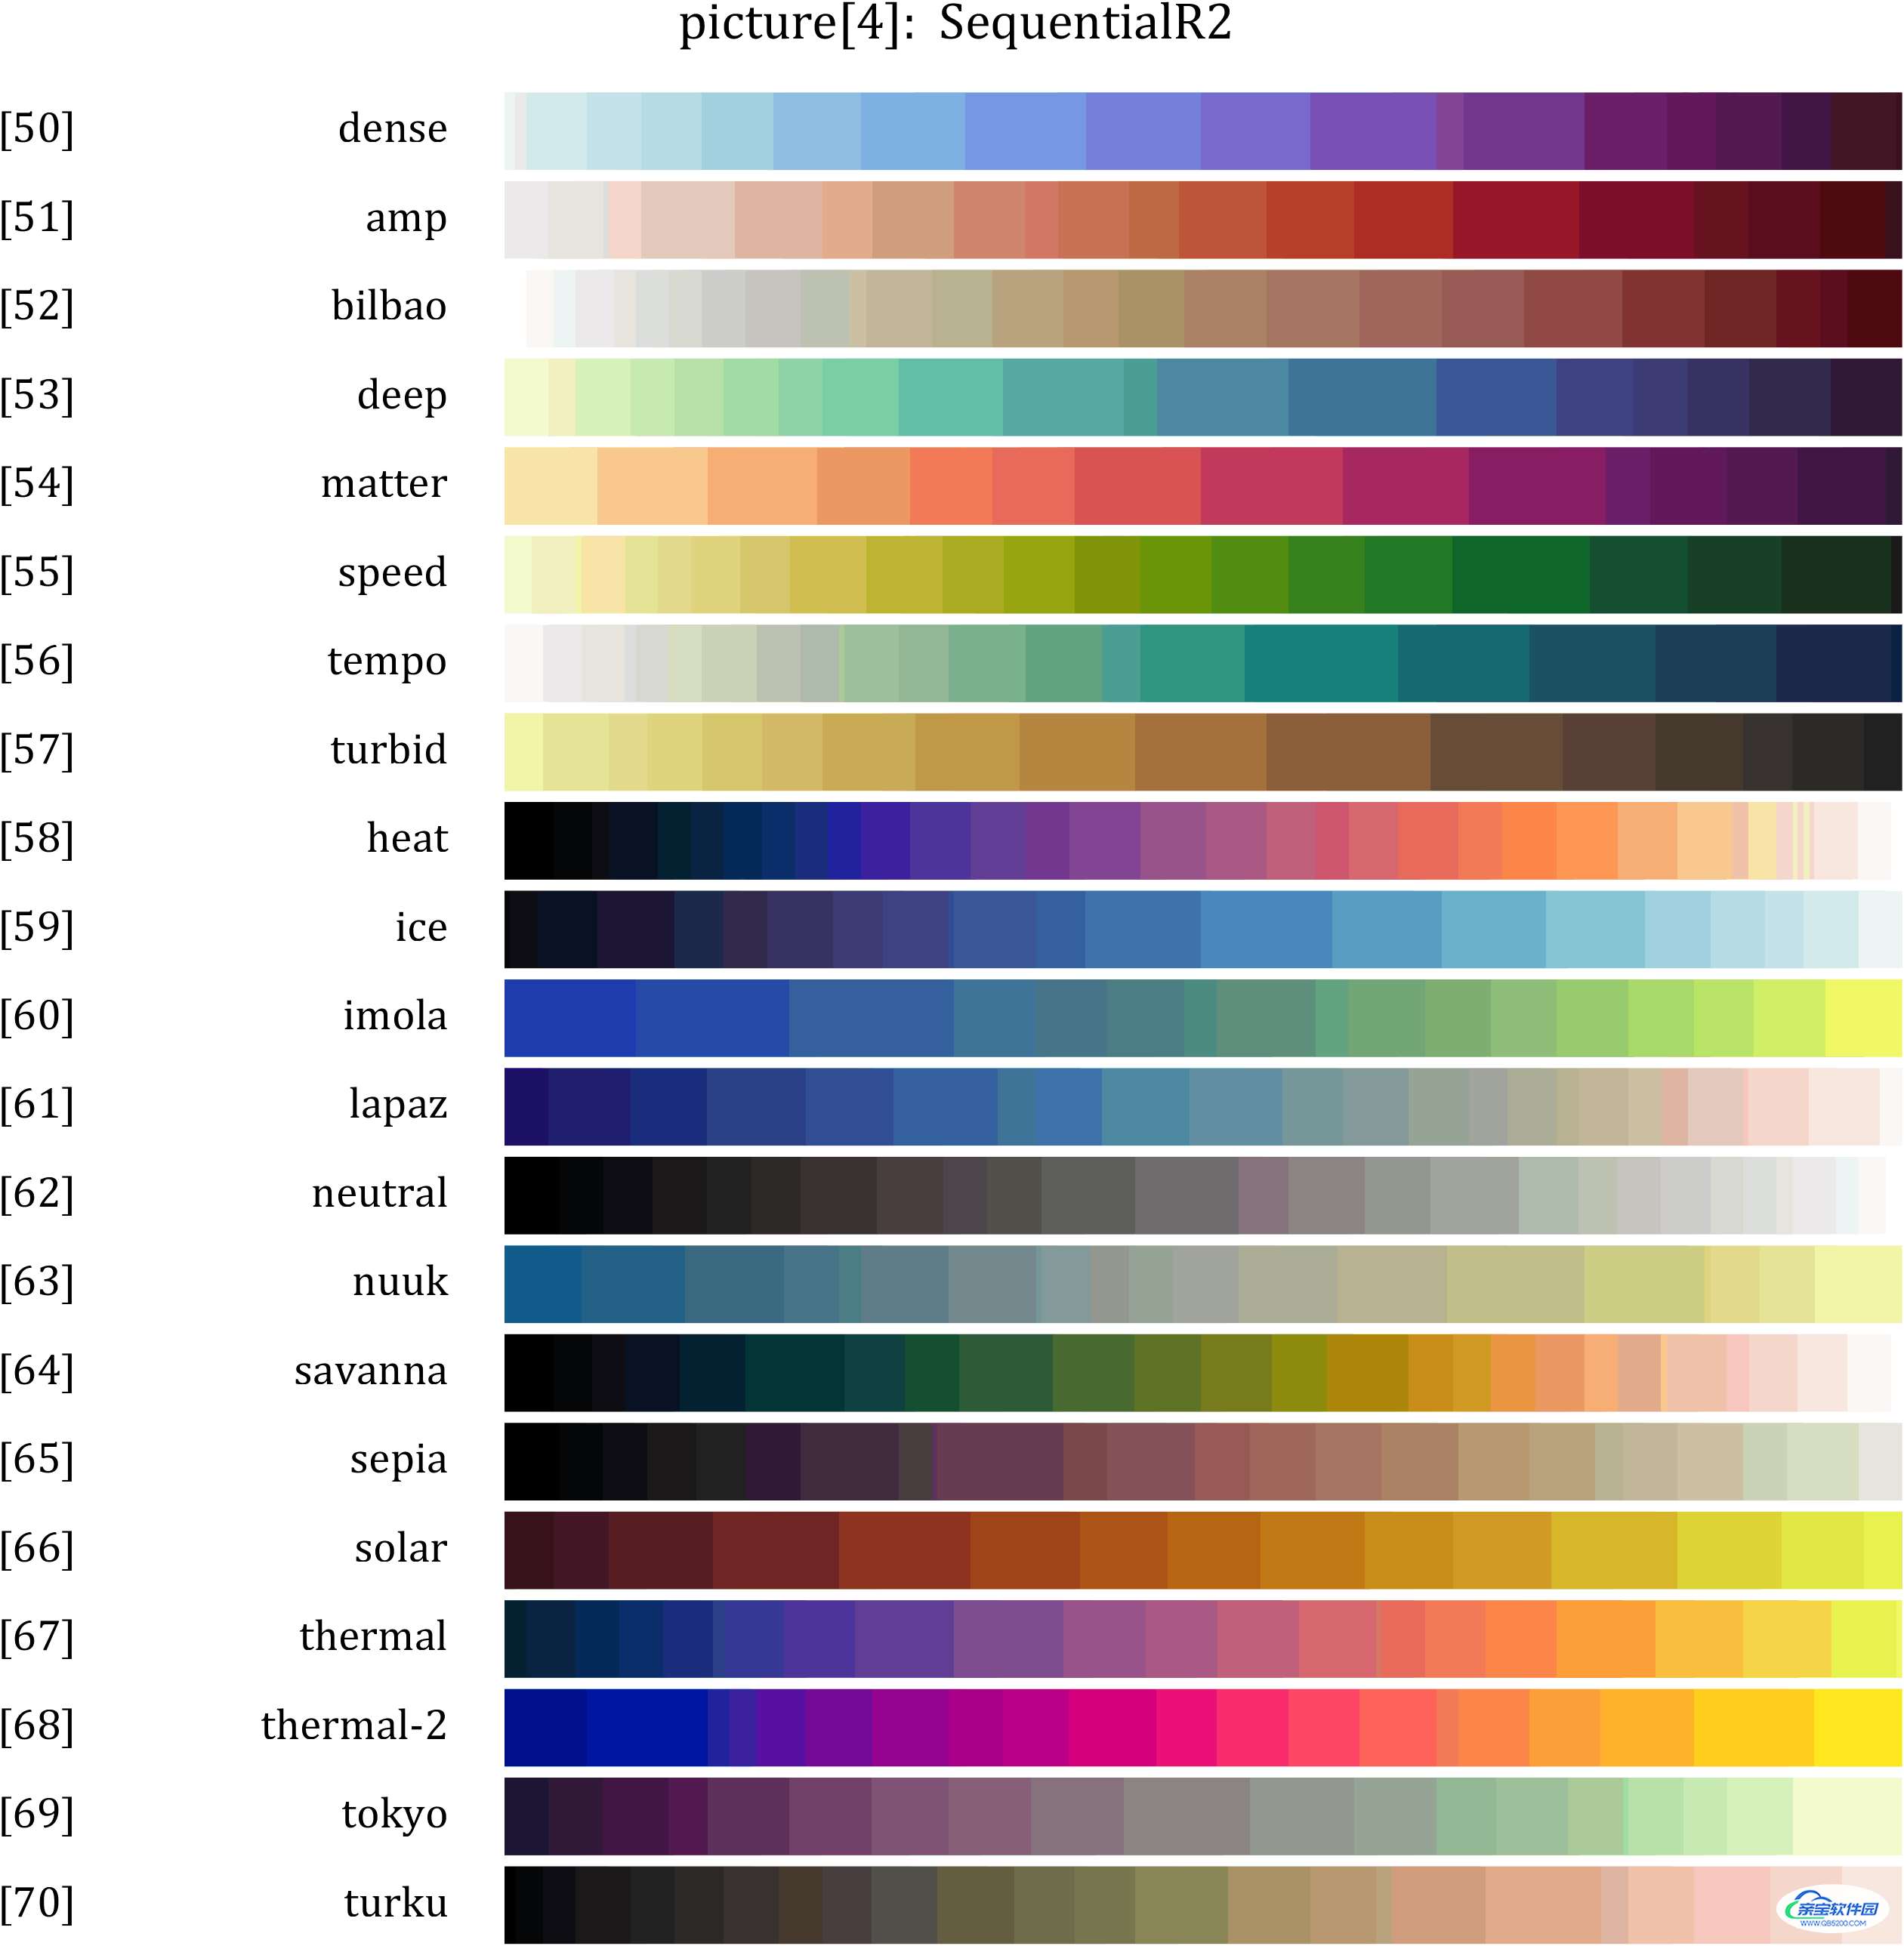
Pure Sequential 颜色较纯单方向渐变:
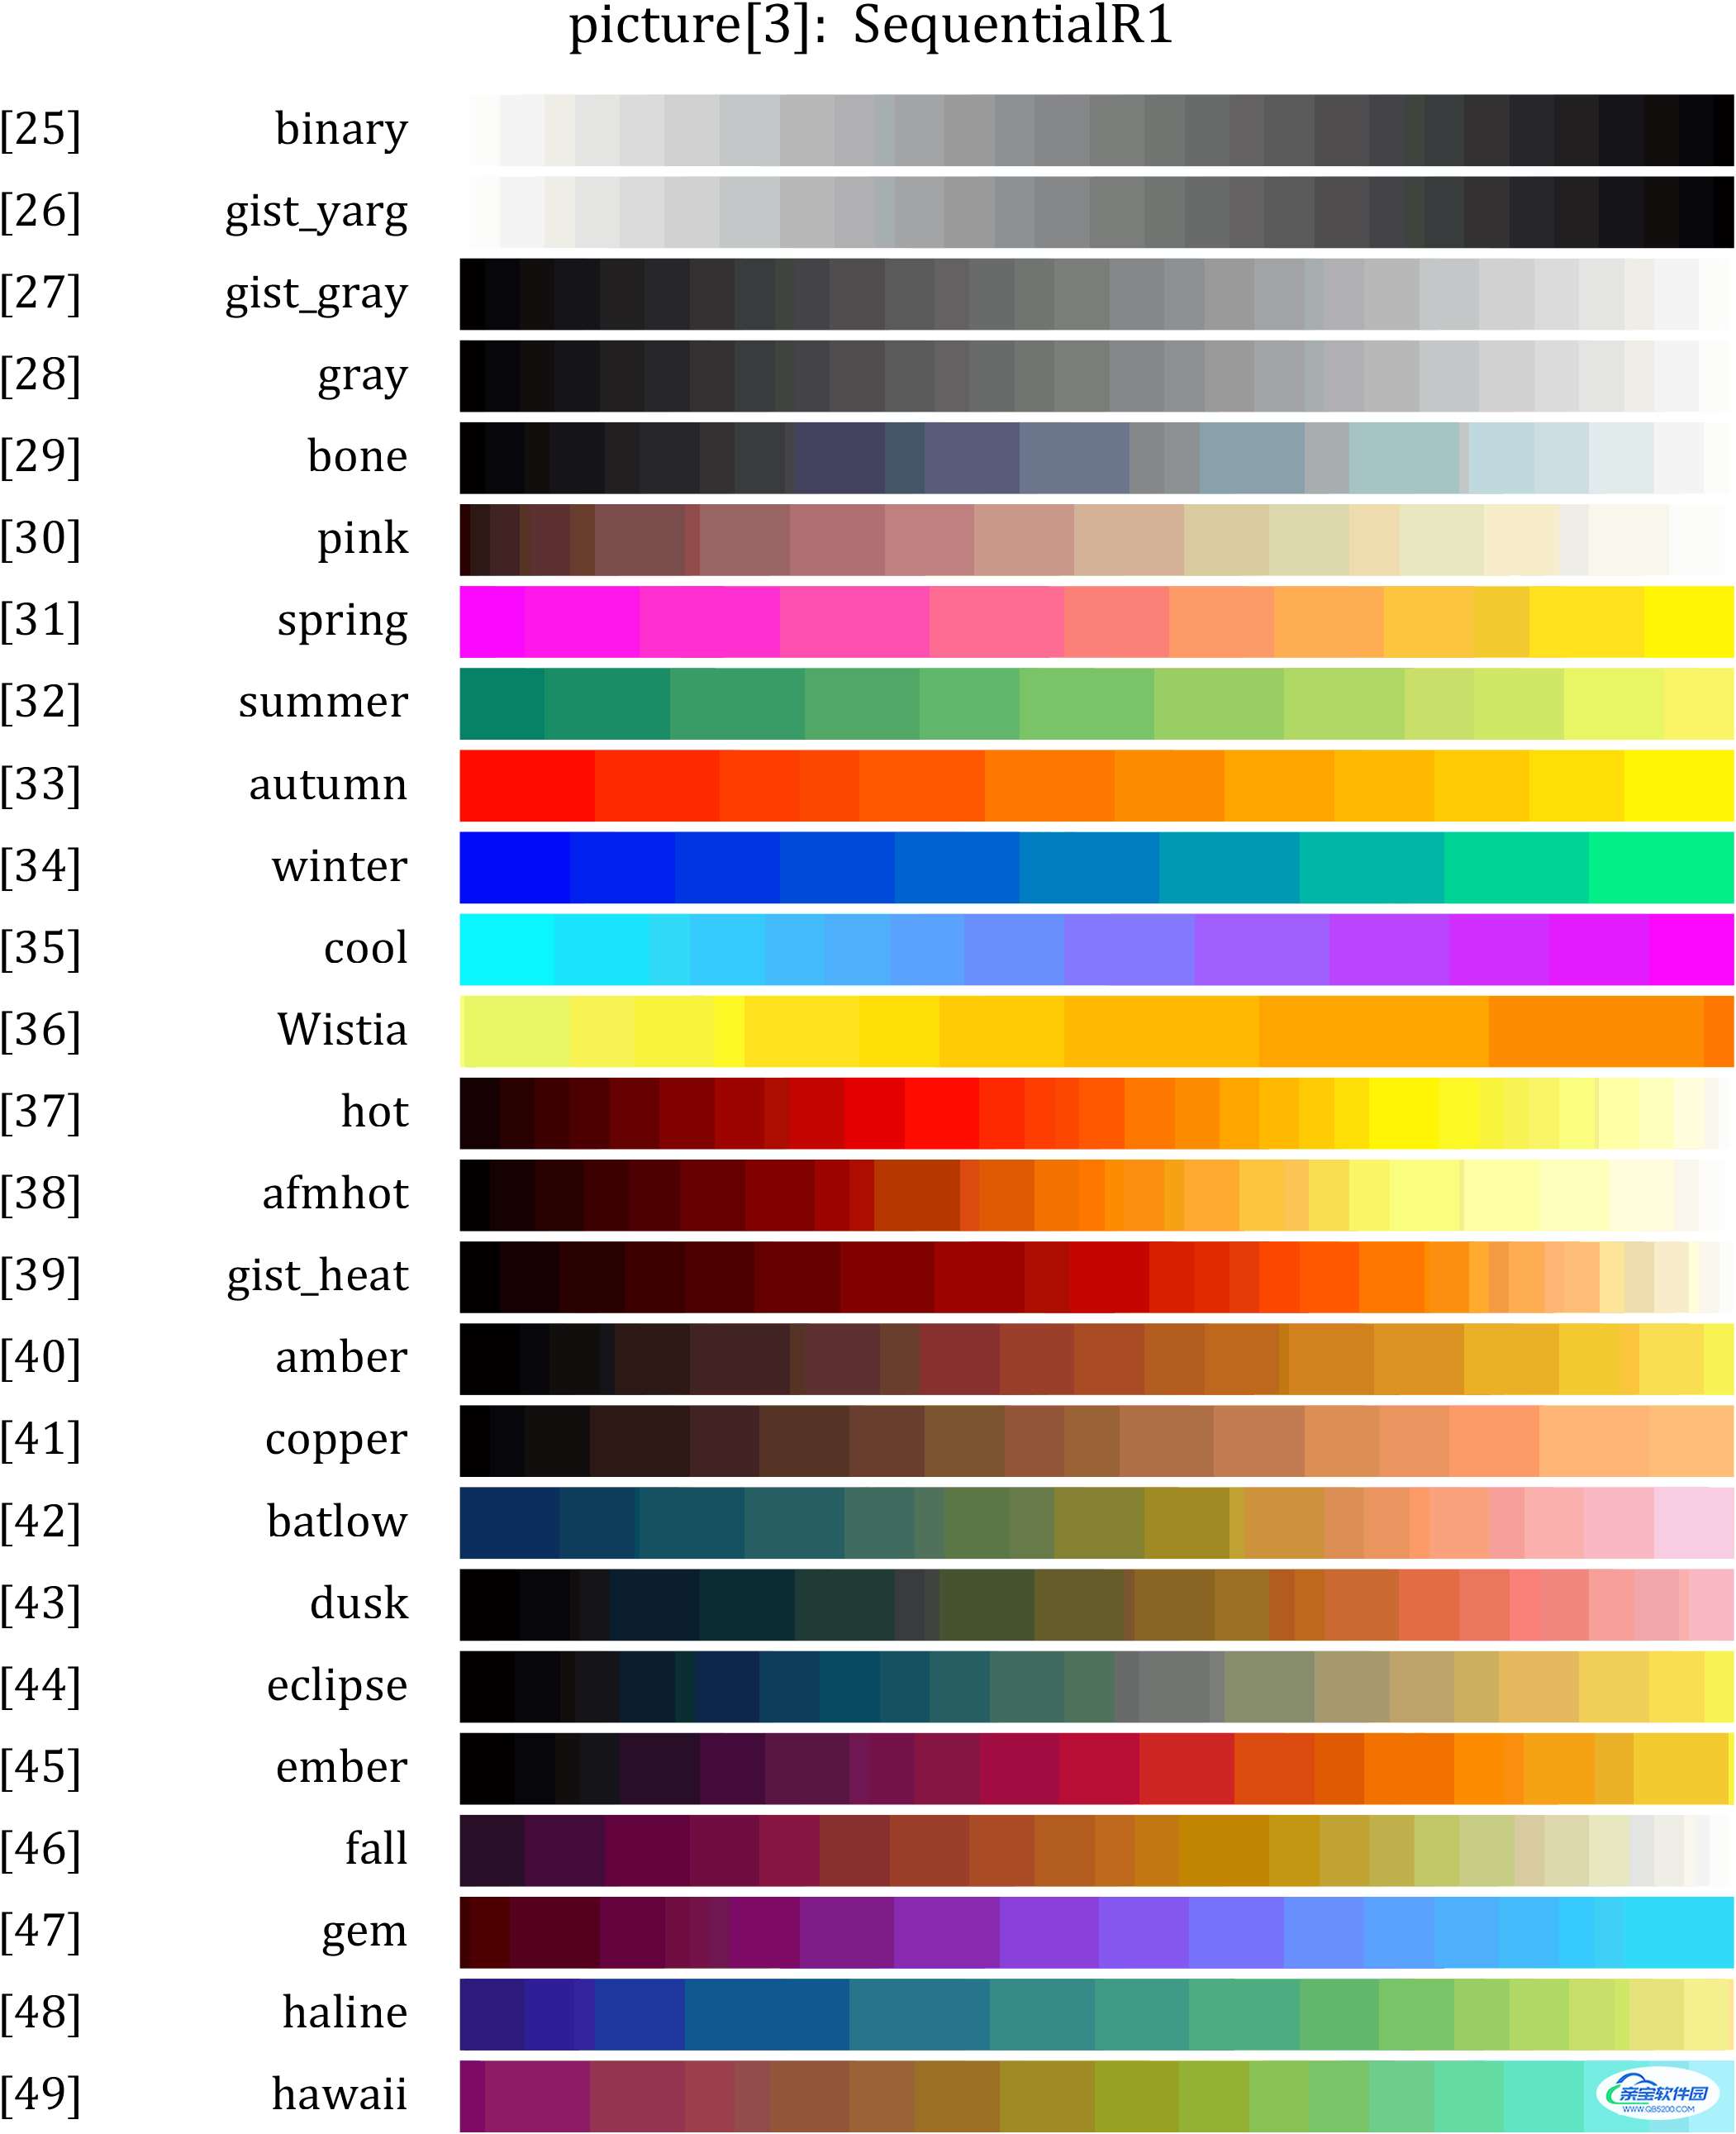
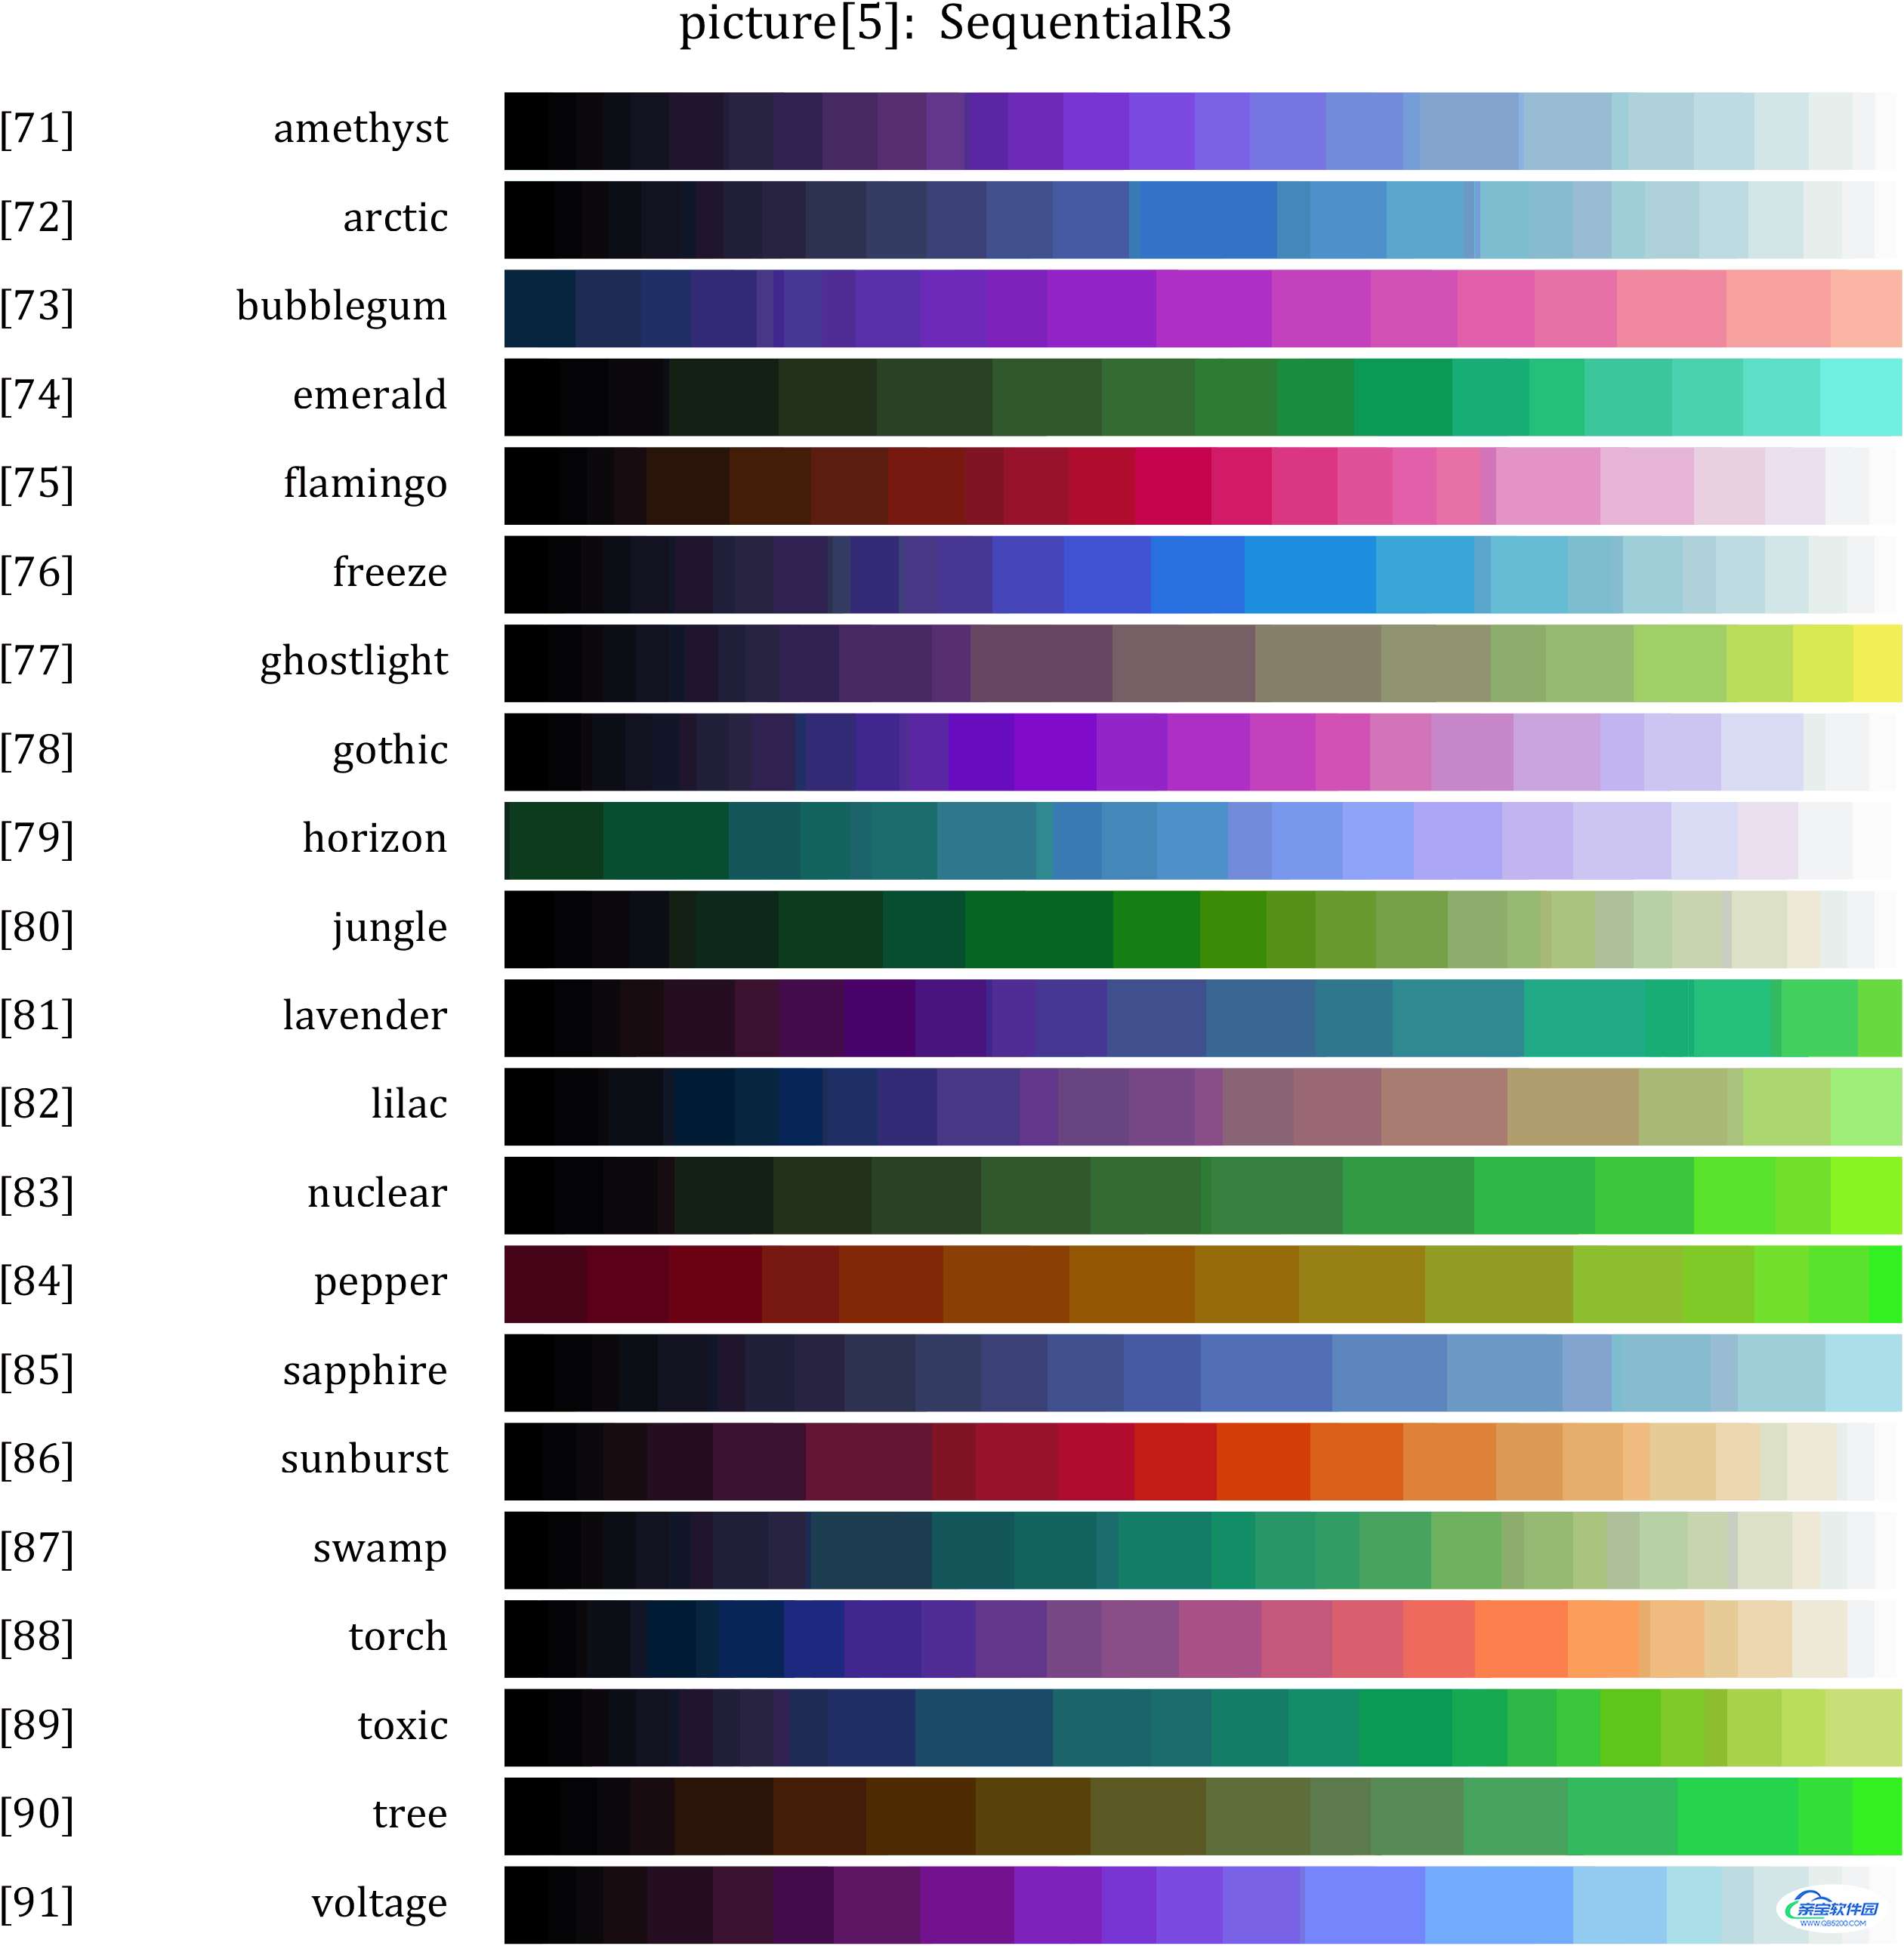
较复杂渐变:
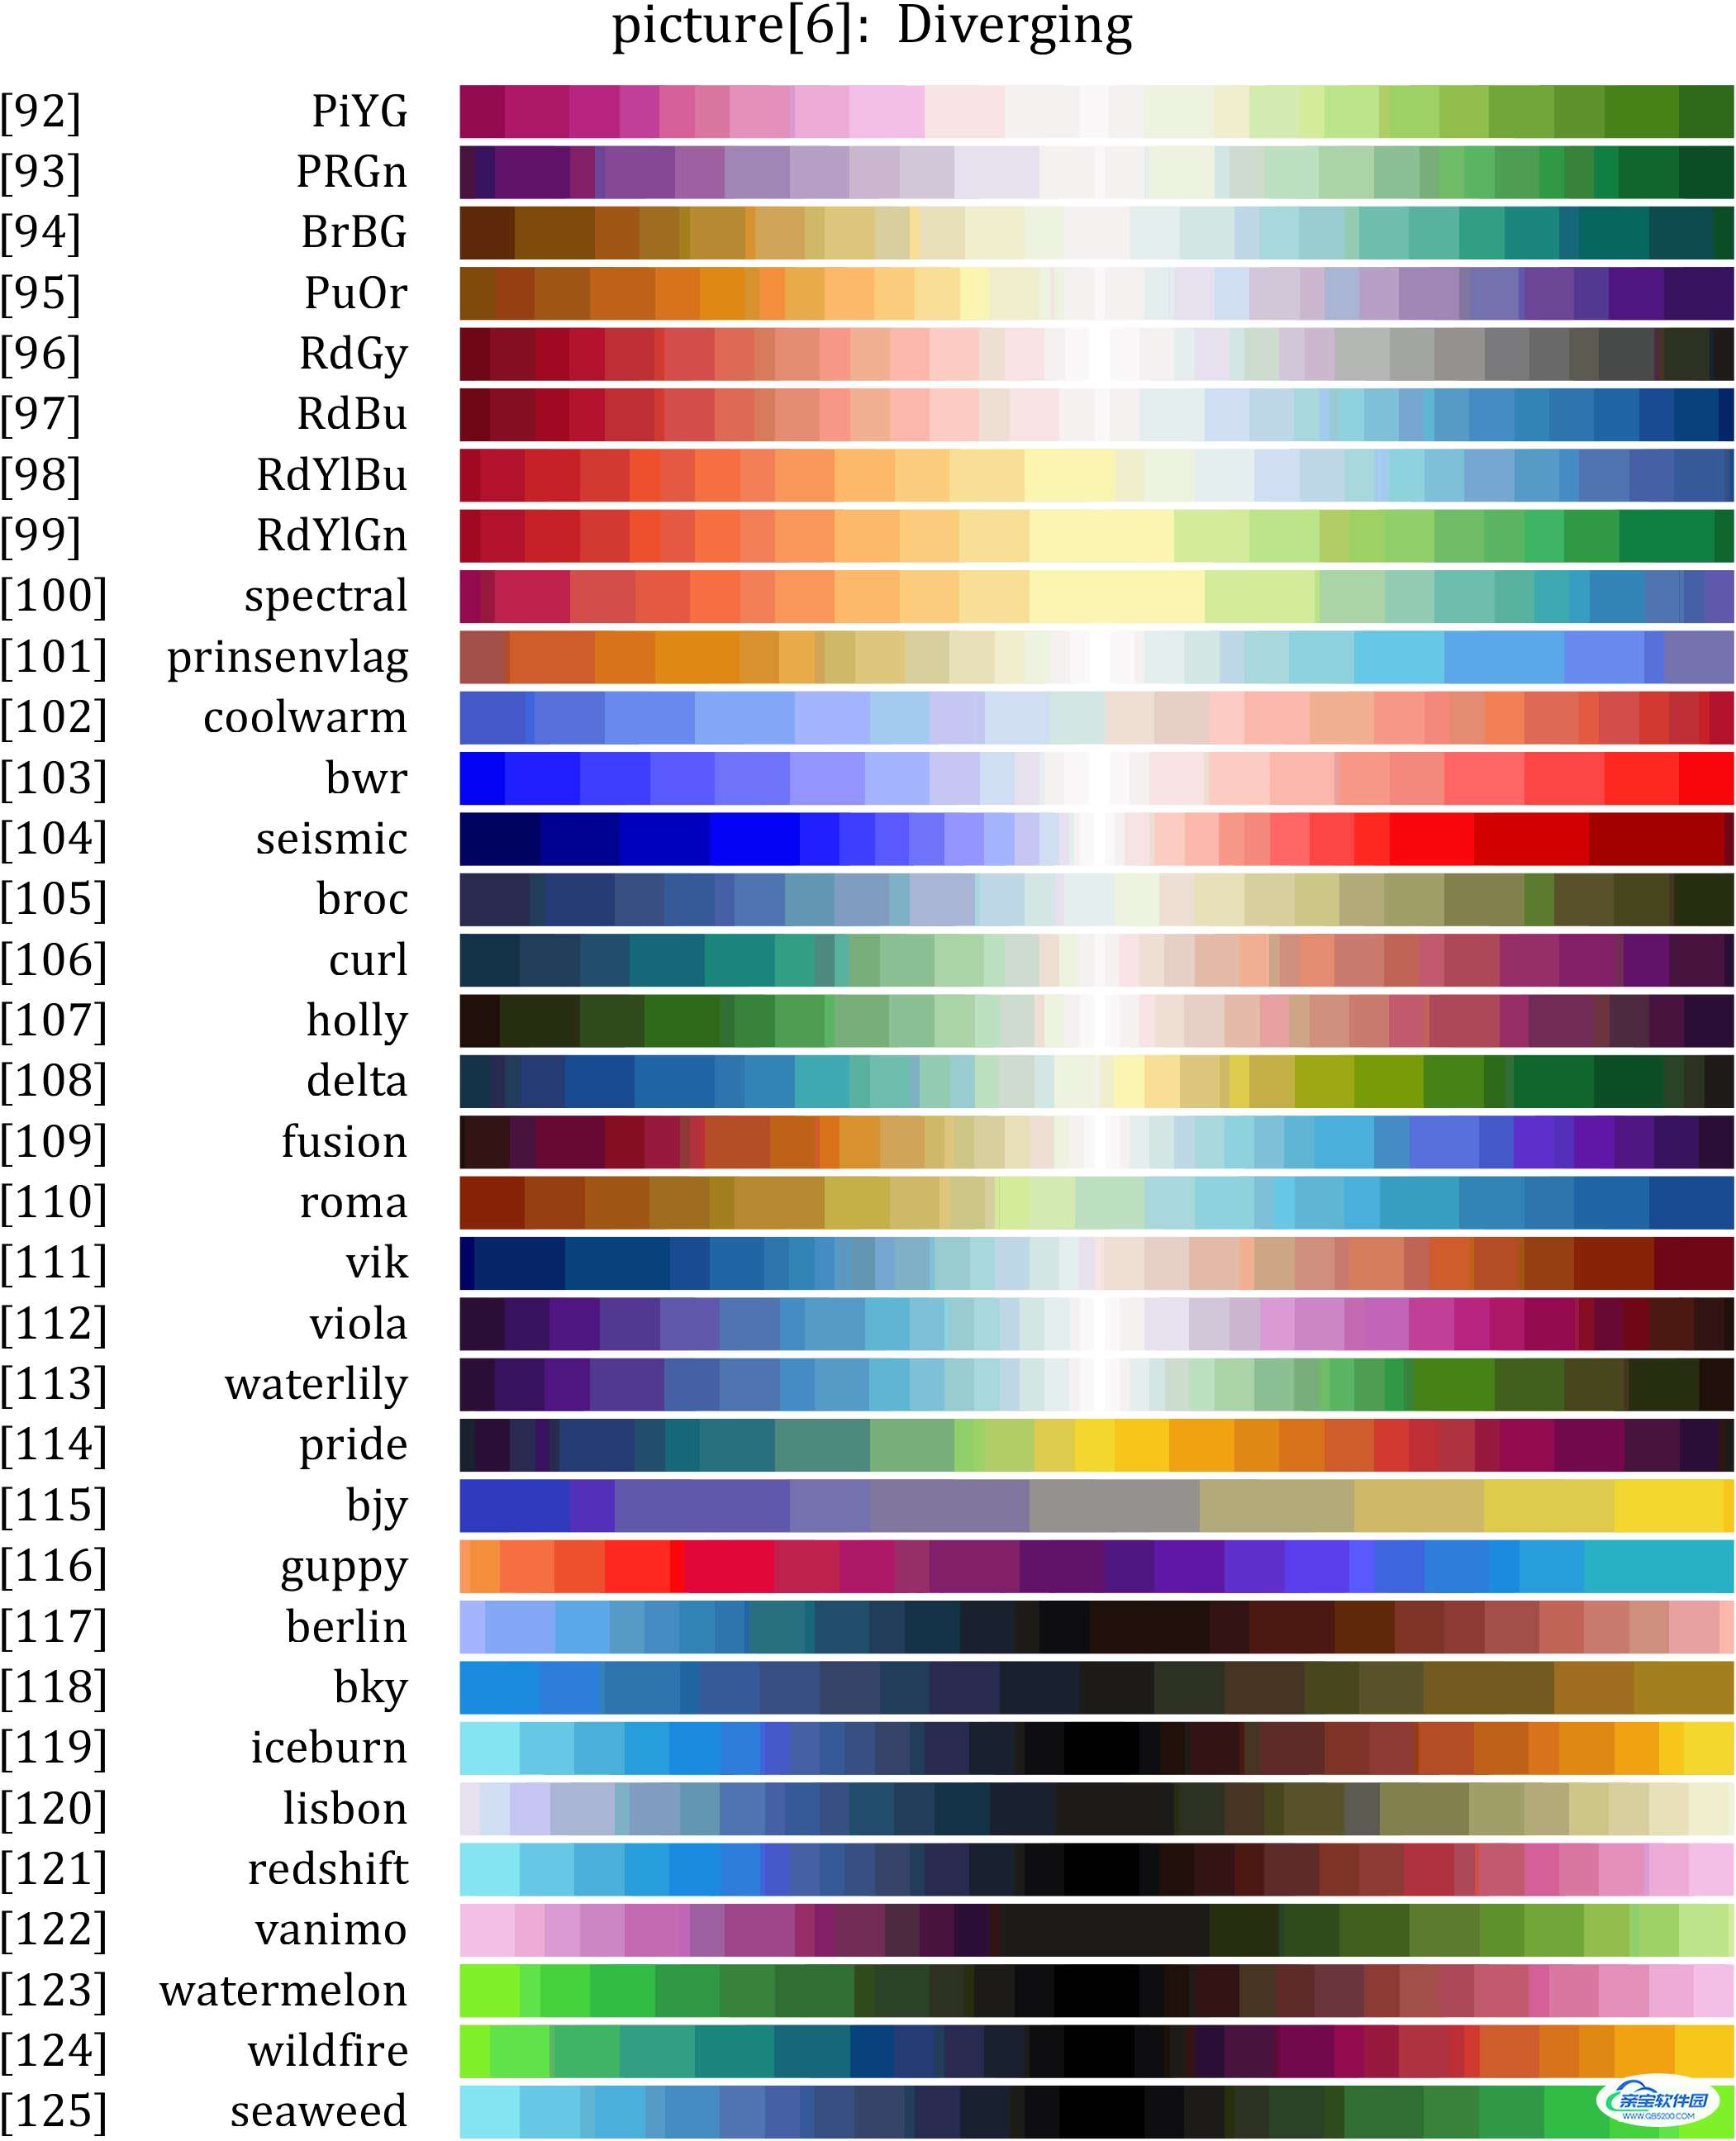
Diverging 双方向渐变:
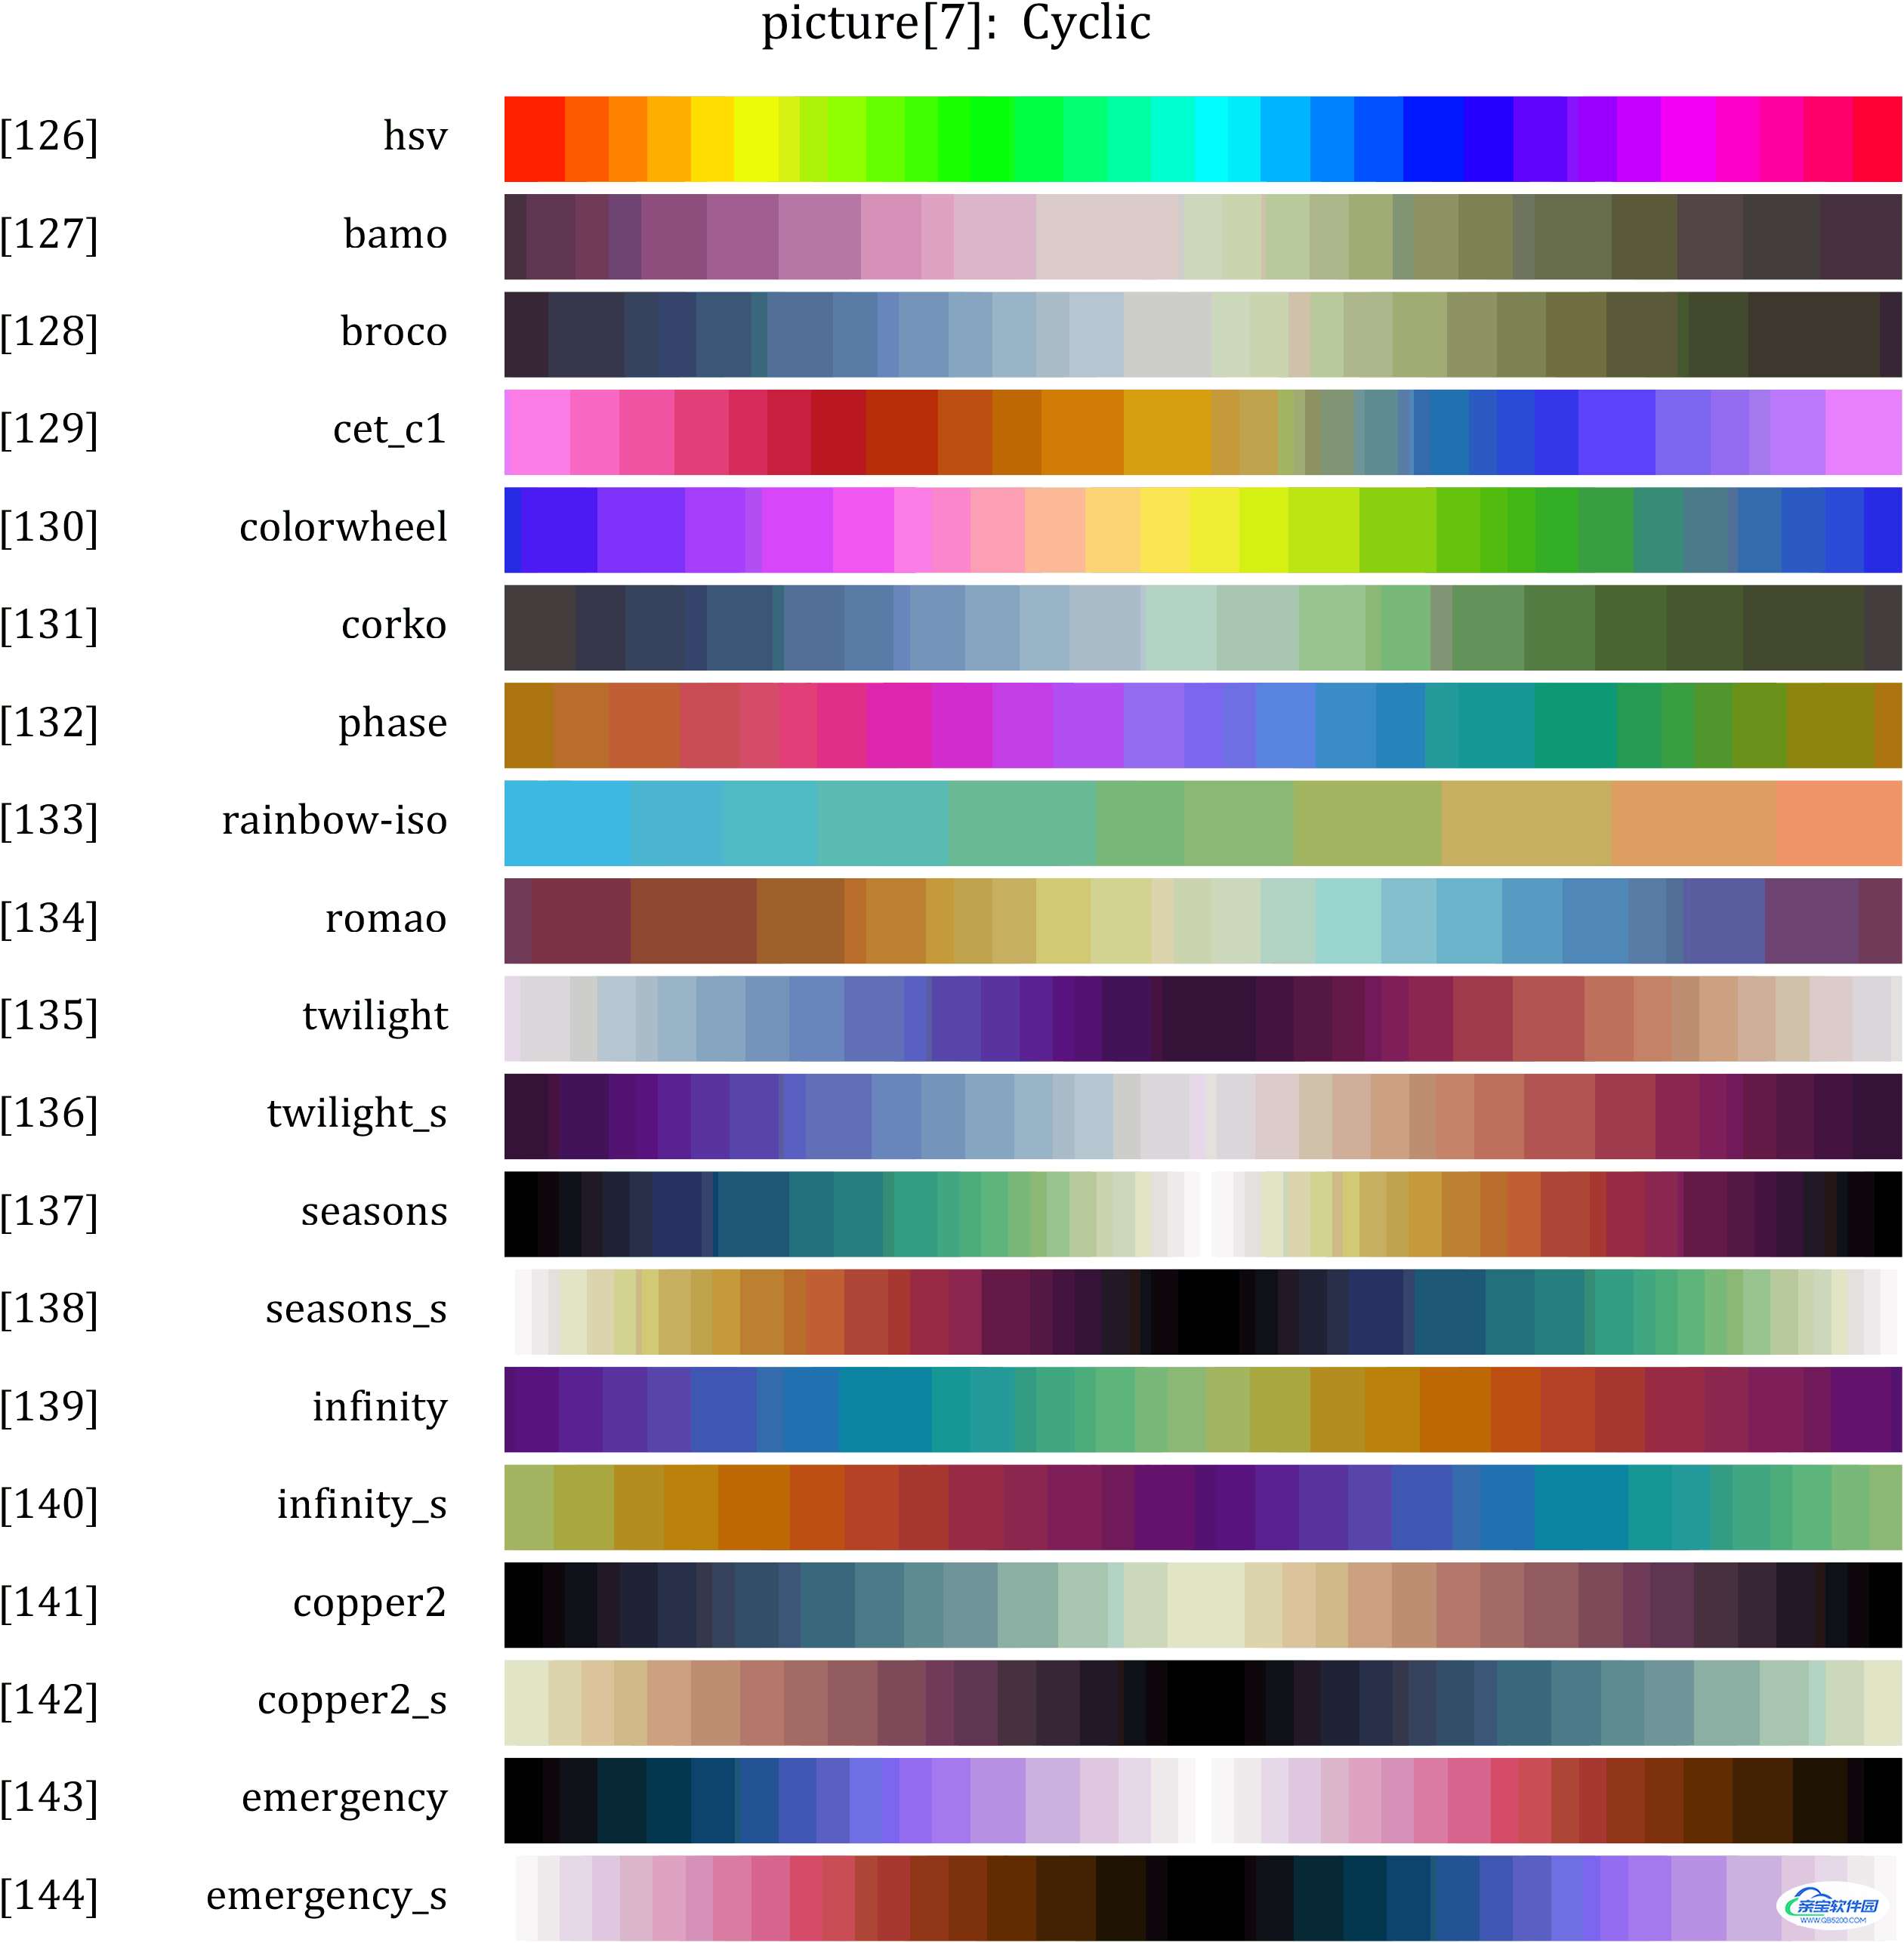
Cyclic 循环渐变(两侧颜色可以对接在一起):
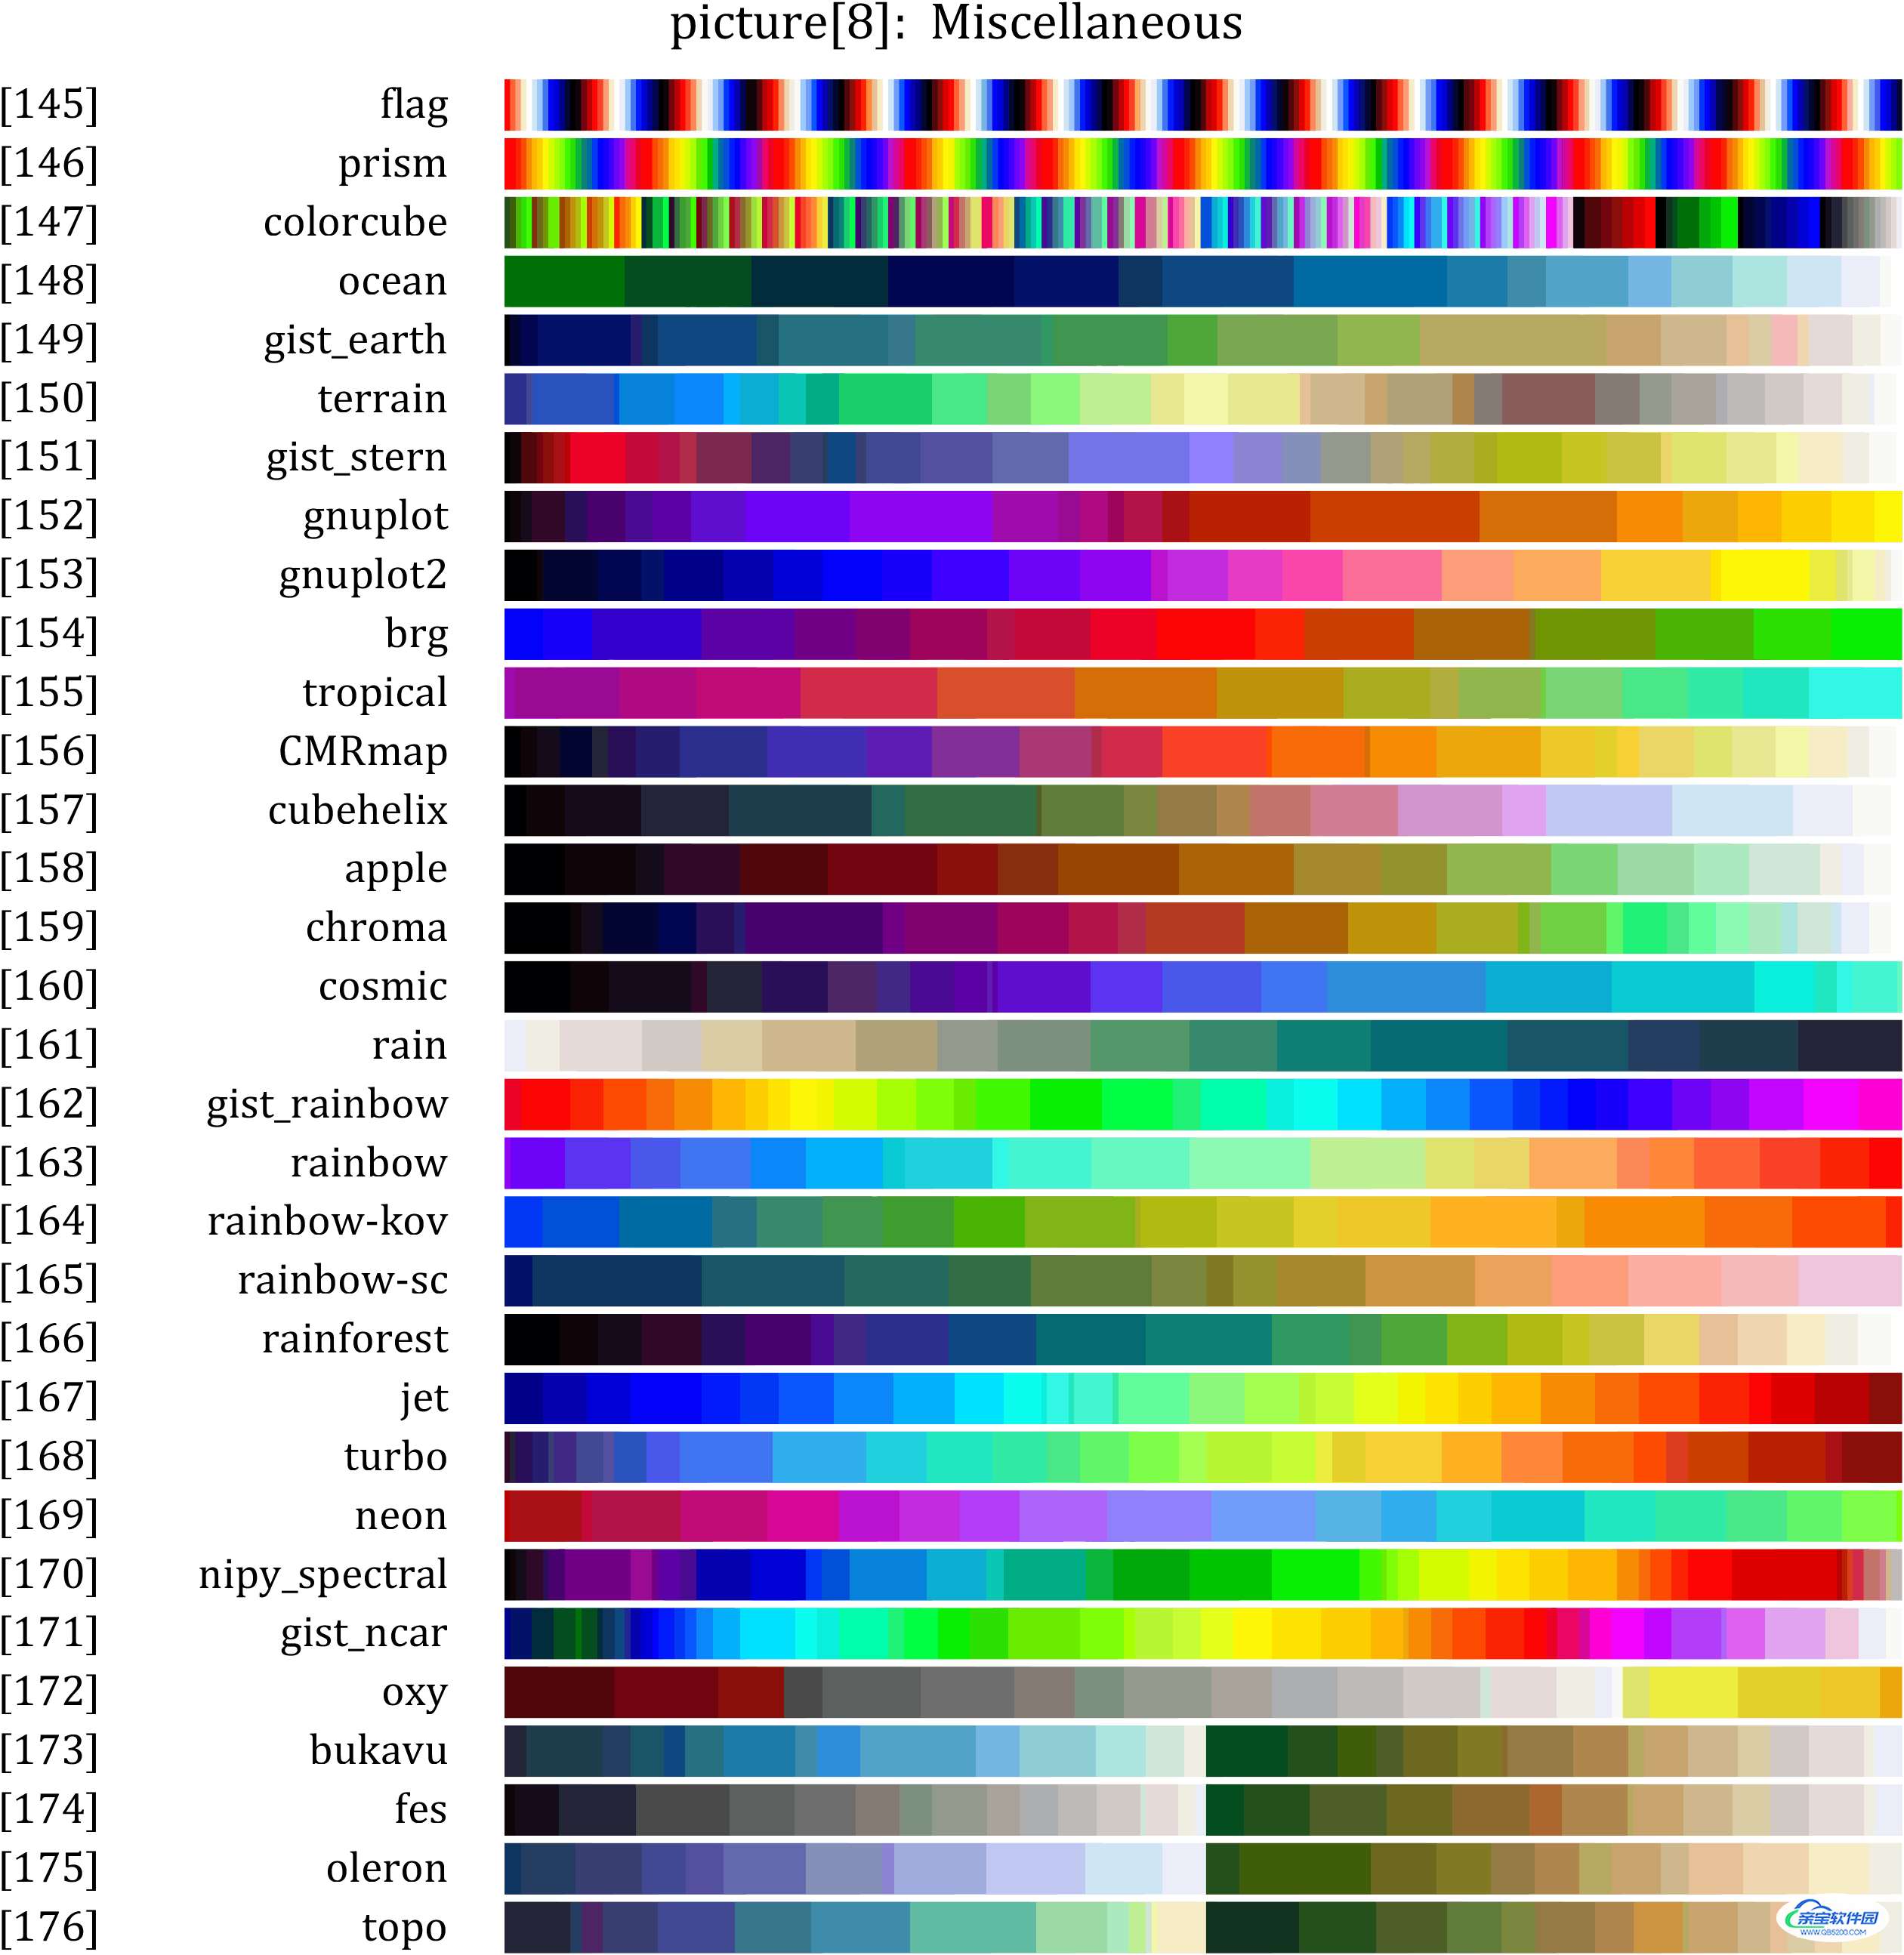
Miscellaneous 混杂渐变色,用于一些山地、光谱等特殊图绘制:
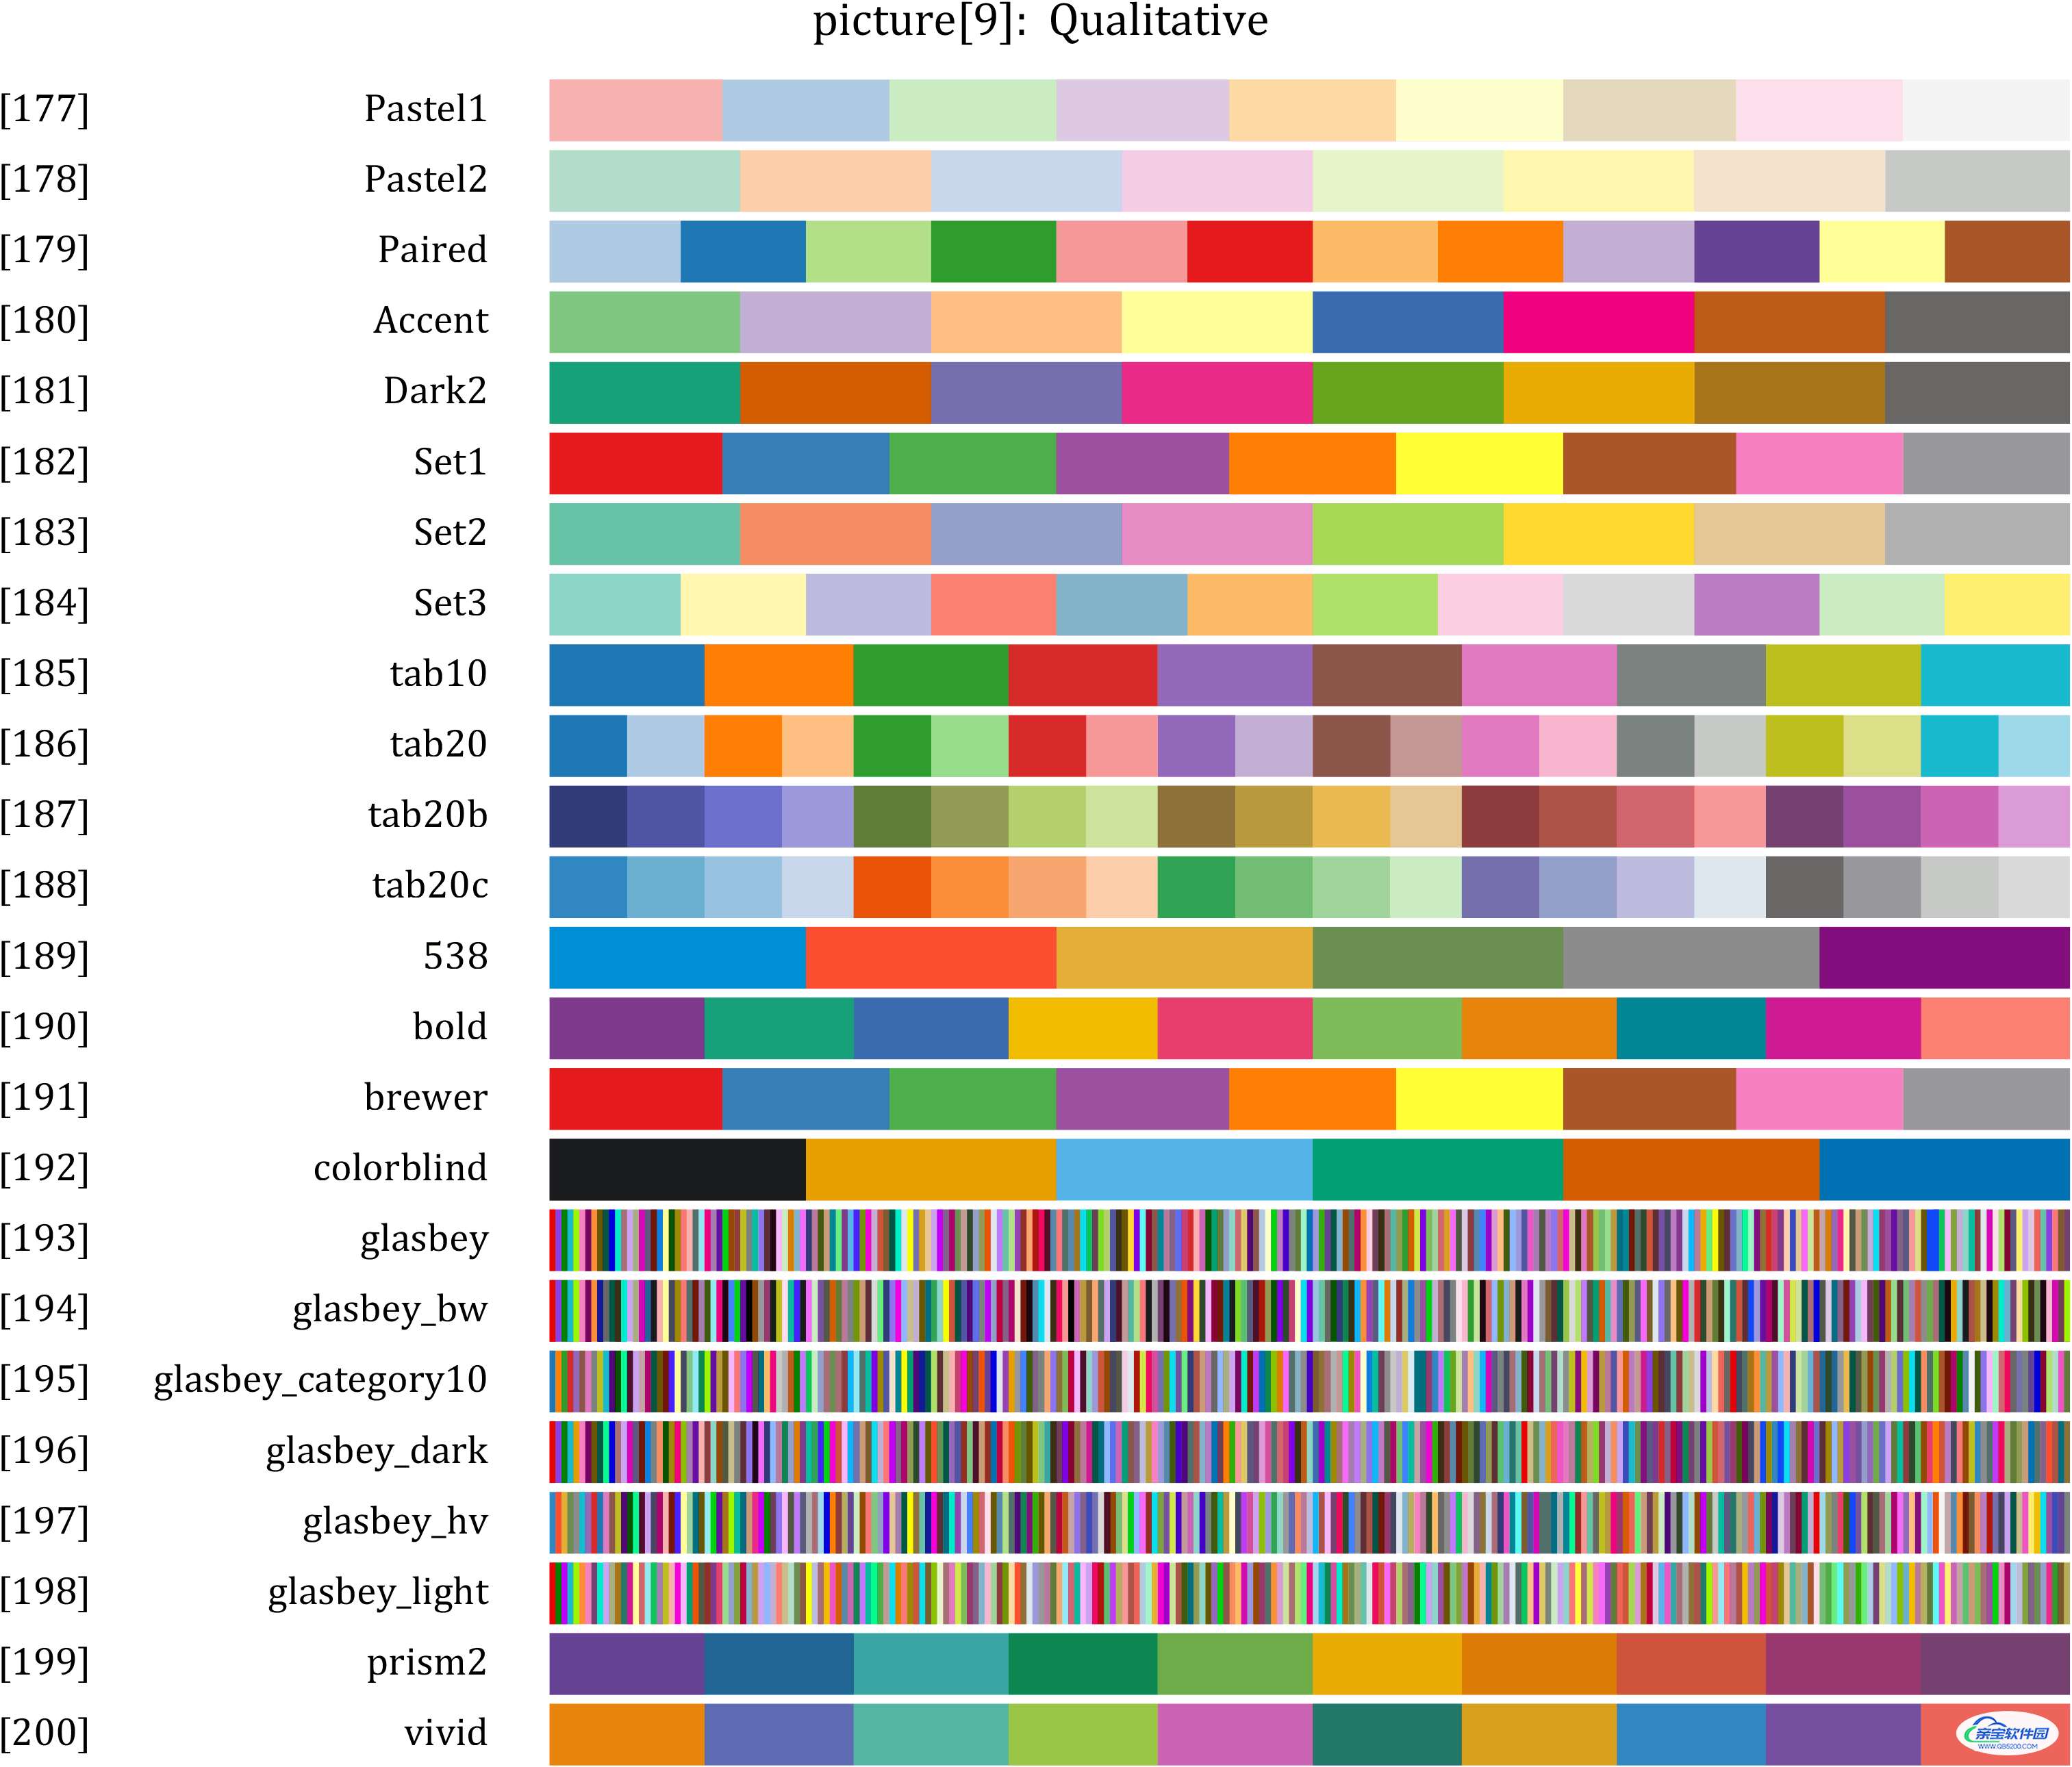
Qualitative 离散colormap:
不指定获取颜色个数会默认256色,举例获取[163]号彩虹色(rainbow),以下两种写法等价:
第二个参数可以指定获取颜色数量,例如获取30颜色:
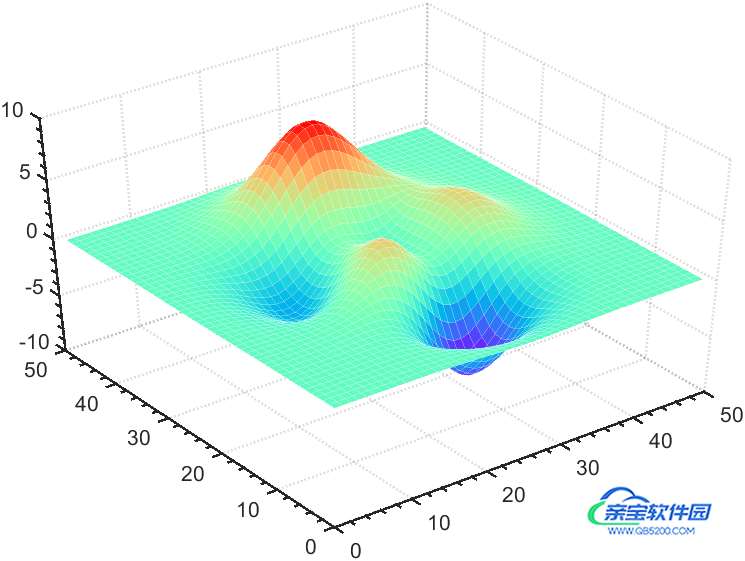
将获取的颜色放入colormap函或者某些图像的CData即可,例如:
colormap(slanCM(‘rainbow’))
使用上述
colormap(slanCM(‘rainbow’))
进行颜色修改:
% demo1
surf(peaks,'EdgeColor','w','EdgeAlpha',.3)
% 使用slanCM的彩虹配色
colormap(slanCM('rainbow'))

% 修饰一下
ax=gca;
ax.Projection='perspective';
ax.LineWidth=1.2;
ax.XMinorTick='on';
ax.YMinorTick='on';
ax.ZMinorTick='on';
ax.GridLineStyle=':';
view(-37,42)
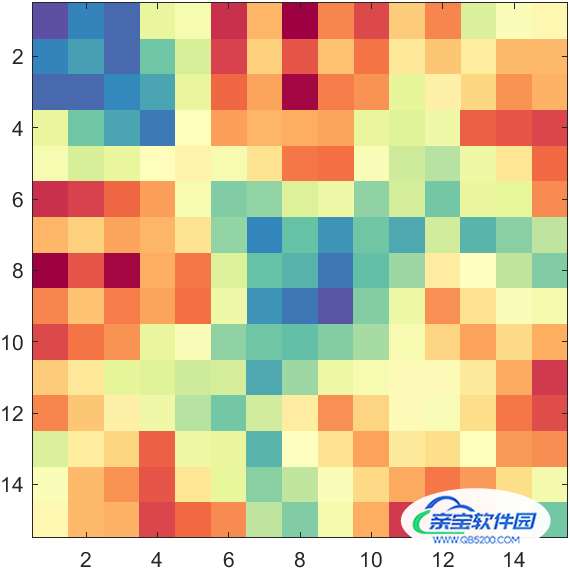
使用100号配色:
% demo2
XData=rand(15,15);
XData=XData+XData.';
H=fspecial('average',3);
XData=imfilter(XData,H,'replicate');

imagesc(XData)
% 使用slanCM的100号配色
colormap(slanCM(100))
hold on

ax=gca;
ax.DataAspectRatio=[1,1,1];
ax.LineWidth=1.2;
ax.XMinorTick='on';
ax.YMinorTick='on';
ax.ZMinorTick='on';
ax.GridLineStyle=':';
view(-37,42)
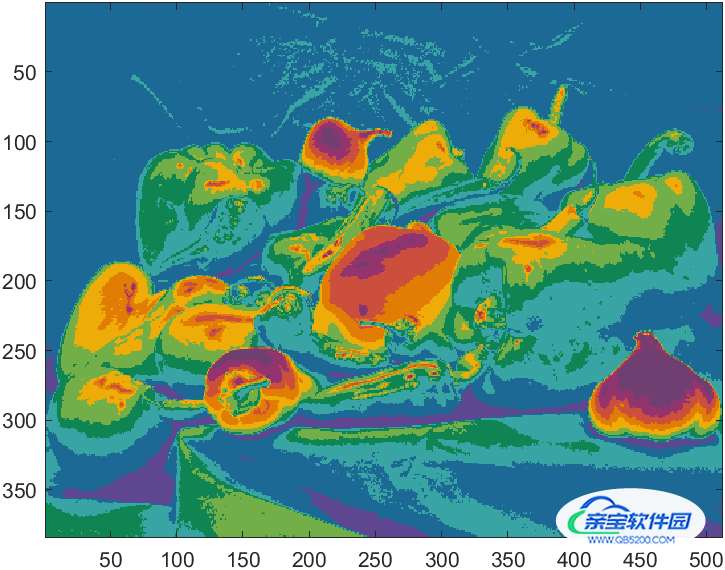
使用离散颜色:
% demo3
rgbImage=imread("peppers.png");
imagesc(rgb2gray(rgbImage))

colormap(slanCM('prism2'))
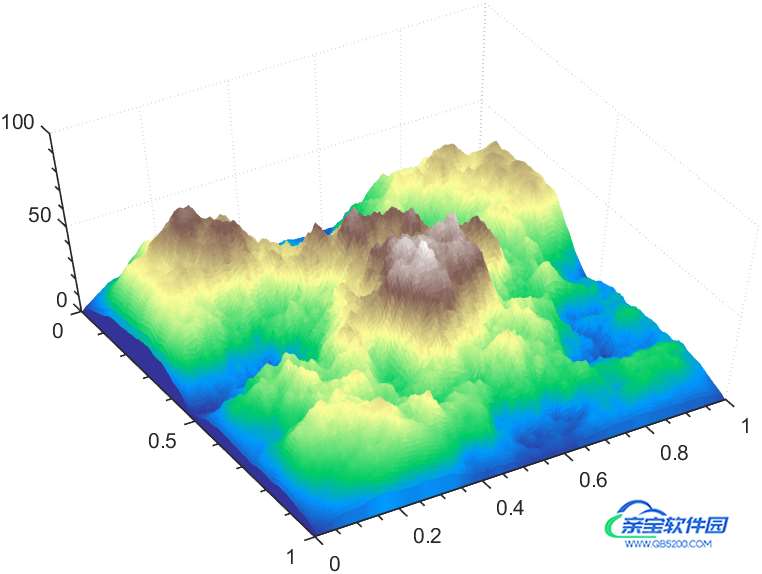
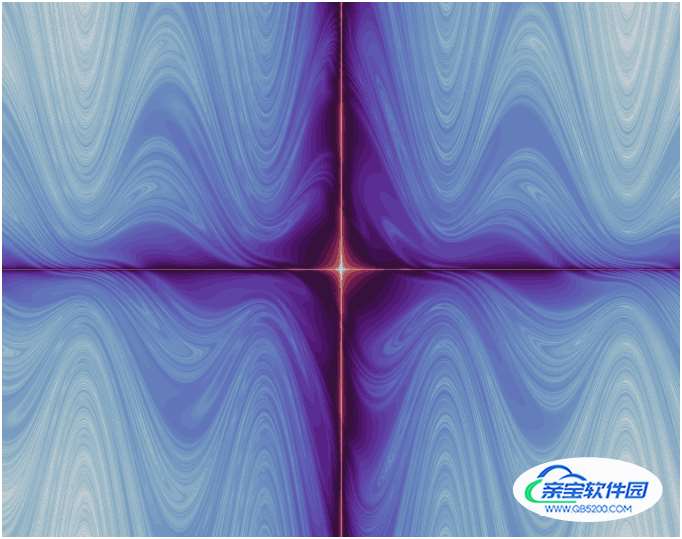
使用特殊地形配色terrain:
% demo4
X=linspace(0,1,200)';
CL=(-cos(X*2*pi)+1).^.2;
r=(X-.5)'.^2+(X-.5).^2;
surf(X,X',abs(ifftn(exp(7i*rand(200))./r.^.9)).*(CL*CL')*30,'EdgeColor','none')

colormap(slanCM('terrain'))
light
material dull
view(59.1823,56.1559)

% 修饰一下
ax=gca;
ax.Projection='perspective';
ax.LineWidth=.8;
ax.XMinorTick='on';
ax.YMinorTick='on';
ax.ZMinorTick='on';
ax.GridLineStyle=':';
加个光照:
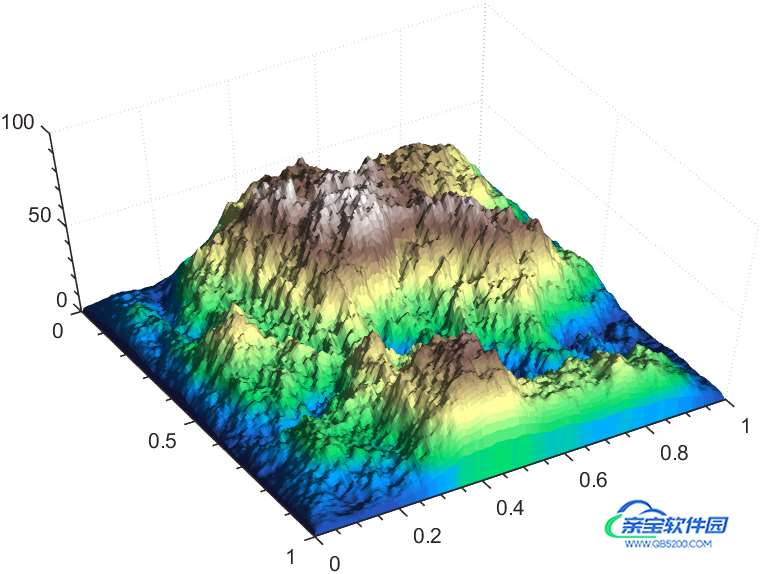
% demo5
X=linspace(0,1,200)';
CL=(-cos(X*2*pi)+1).^.2;
r=(X-.5)'.^2+(X-.5).^2;
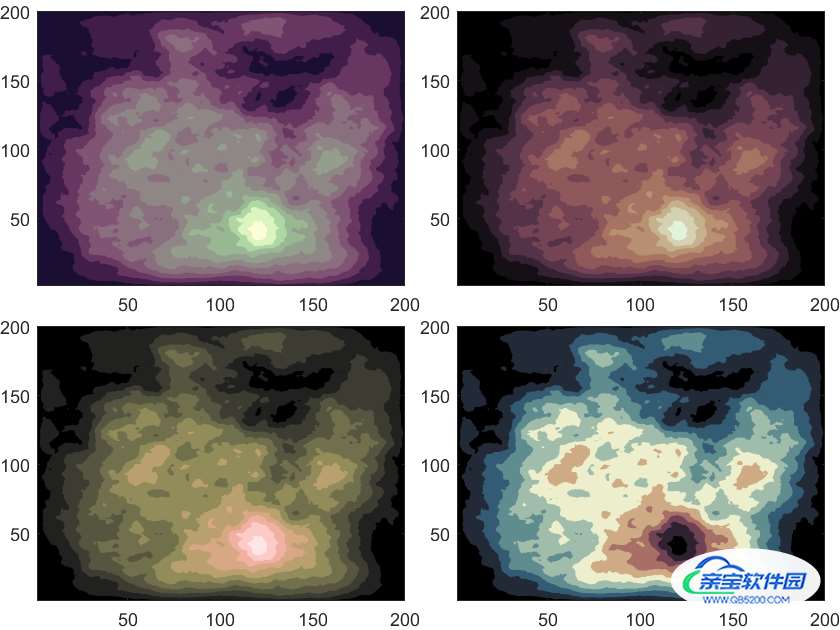
Z=abs(ifftn(exp(7i*rand(200))./r.^.9)).*(CL*CL')*30;
ax1=axes('Parent',gcf,'OuterPosition',[0,1/2,1/2,1/2],'LooseInset',[0,0,0,0]);
contourf(Z,'EdgeColor','none')
ax1.Colormap=slanCM('tokyo',200);
ax2=axes('Parent',gcf,'OuterPosition',[1/2,1/2,1/2,1/2],'LooseInset',[0,0,0,0]);
contourf(Z,'EdgeColor','none')
ax2.Colormap=slanCM('sepia',200);
ax3=axes('Parent',gcf,'OuterPosition',[0,0,1/2,1/2],'LooseInset',[0,0,0,0]);
contourf(Z,'EdgeColor','none')
ax3.Colormap=slanCM('turku',200);
ax4=axes('Parent',gcf,'OuterPosition',[1/2,0,1/2,1/2],'LooseInset',[0,0,0,0]);
contourf(Z,'EdgeColor','none')
ax4.Colormap=slanCM('copper2',200);
% demo6
% MvLevi :https://ww2.mathworks.cn/matlabcentral/communitycontests/contests/5/entries/10775
C=-9:9e-3:9;D=-9:9e-3:9;
for q=1:2001
    for j=1:2001
        X=.5;
        for i=1:5
            if mod(i,2)==0
                X(i+1)=X(i)-C(q)*(.5+.3*cos(X(i)))^-1;
            else
                X(i+1)=X(i)-D(j)*(.5+.3*cos(X(i)))^-1;
            end
        end
        P=diff(X);
        L(q,j)=mean(log(abs(P)));
    end
end
pcolor(C,D,-L)
shading flat
axis off
caxis([-3.5 3.5])

colormap(slanCM('twilight'))
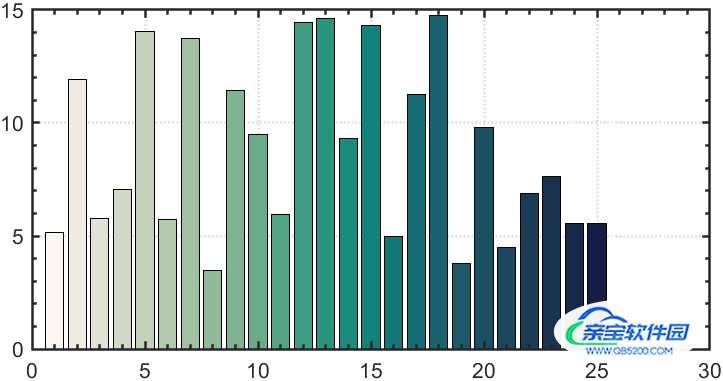
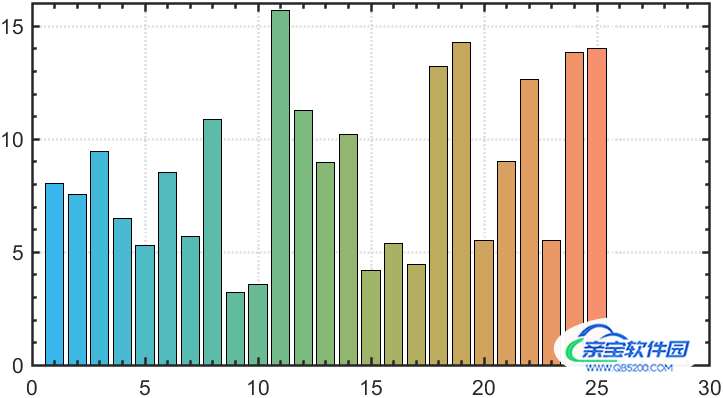
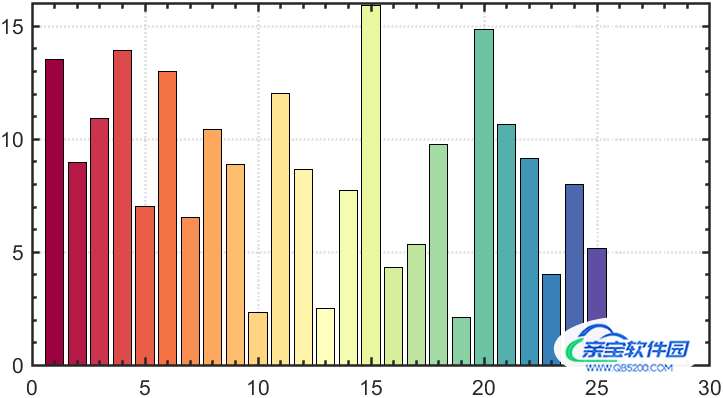
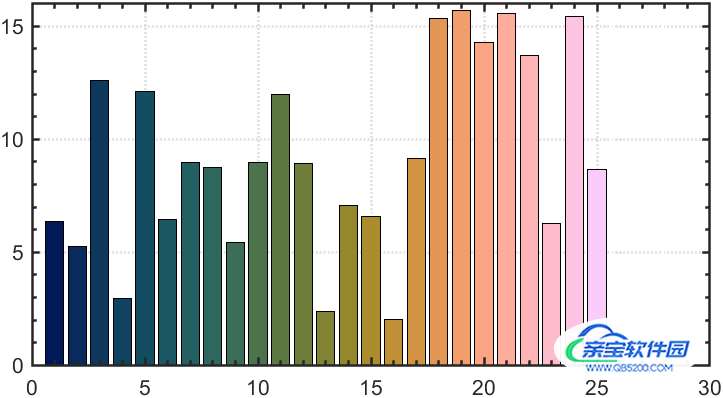
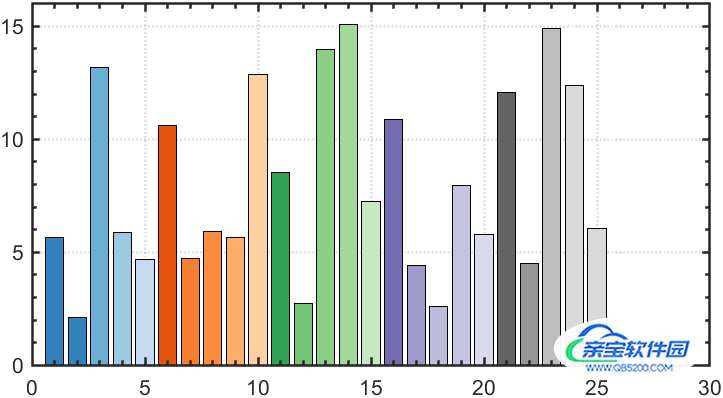
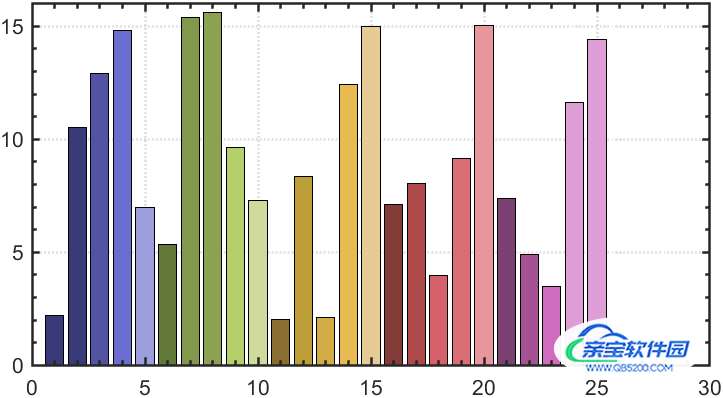
多试了几个颜色:
% demo7
X=randi([2,15],[1,25])+rand([1,25]);
b=bar(X);

CMap=slanCM('hsv');
b.FaceColor='flat';
b.CData=slanCM(188,length(b.XData));
% 42 56 63 100 133 187 188

% 修饰一下
ax=gca;hold on;grid on
ax.DataAspectRatio=[1,1,1];
ax.LineWidth=1.2;
ax.XMinorTick='on';
ax.YMinorTick='on';
ax.ZMinorTick='on';
ax.GridLineStyle=':';

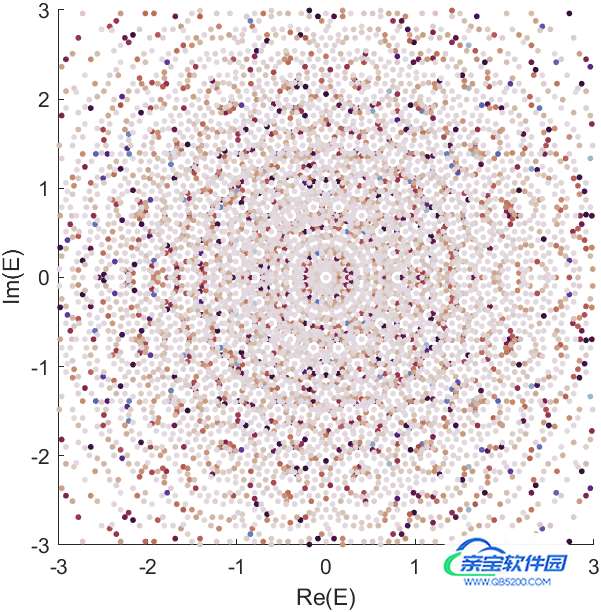
% demo8
rng('default')
for i = 1:20000
  x = -0.4 + 0.8*randi([0 1],1,18);
  A = gallery('circul',x);
  E(:,i) = eig(A);
end
scatter(real(E(:)),imag(E(:)),8,'filled','CData',slanCM('twilight',length(E(:))))
xlabel('Re(E)')
ylabel('Im(E)')
xlim([-3 3])
ylim([-3 3])
axis square
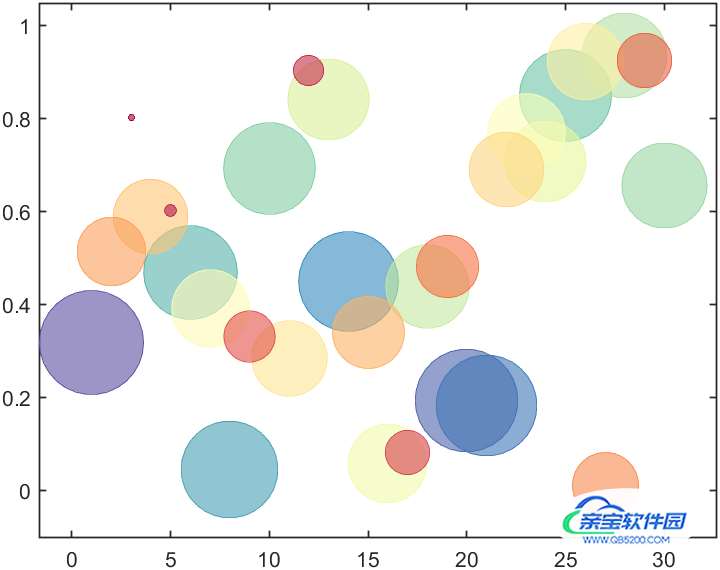
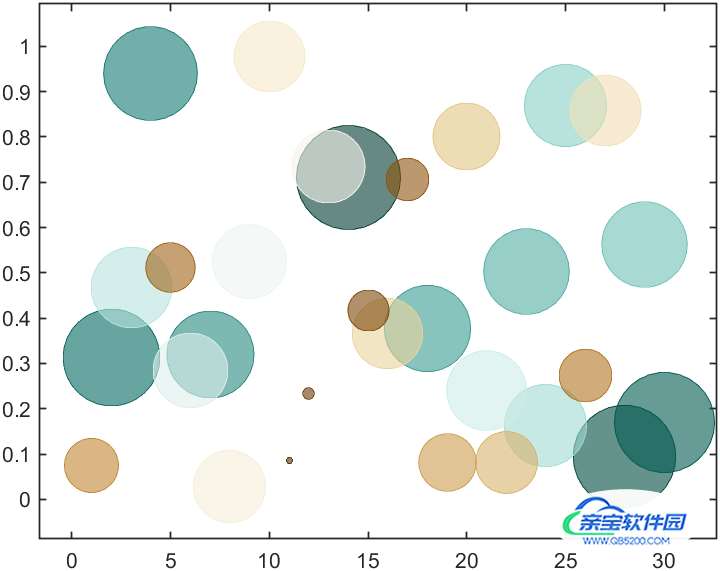
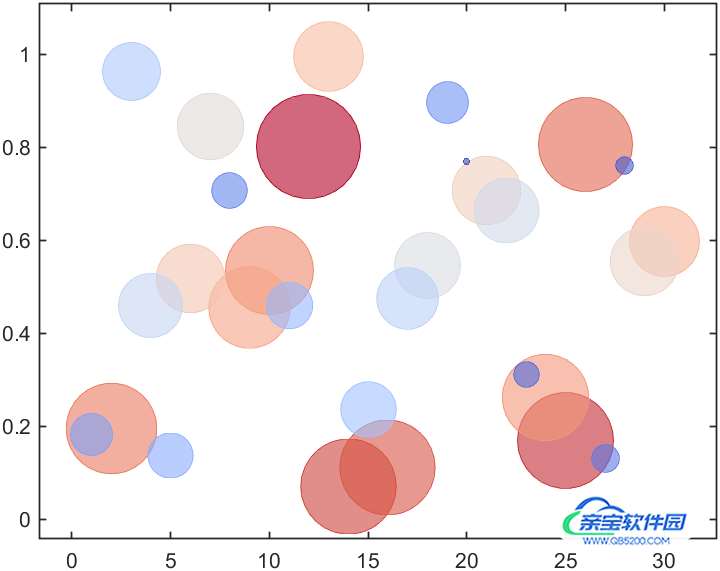
% demo9
x=1:30;
[~,ind]=sort(rand(1,30));
x=x(ind);
y=rand(1,30);
sz=sort(rand(1,30));

% 100 102 94
bubblechart(x,y,sz,'CData',slanCM(94,30));

% 修饰一些
ax=gca;hold on
ax.LineWidth=.8;
鉴于一部分人问过我咋从python获取颜色,这里给两段python代码:
matplotlab获取全部颜色:
import numpy as np
import matplotlib.pyplot as plt

cmaps = [('Perceptually Uniform Sequential', [
            'viridis', 'plasma', 'inferno', 'magma', 'cividis']),
         ('Sequential', [
            'Greys', 'Purples', 'Blues', 'Greens', 'Oranges', 'Reds', 'YlOrBr', 'YlOrRd', 'OrRd', 'PuRd', 'RdPu', 'BuPu', 'GnBu', 'PuBu', 'YlGnBu', 'PuBuGn', 'BuGn', 'YlGn']),
         ('Sequential (2)', [
            'binary', 'gist_yarg', 'gist_gray', 'gray', 'bone', 'pink', 'spring', 'summer', 'autumn', 'winter', 'cool', 'Wistia', 'hot', 'afmhot', 'gist_heat', 'copper']),
         ('Diverging', [
            'PiYG', 'PRGn', 'BrBG', 'PuOr', 'RdGy', 'RdBu', 'RdYlBu', 'RdYlGn', 'Spectral', 'coolwarm', 'bwr', 'seismic']),
         ('Cyclic', ['twilight', 'twilight_shifted', 'hsv']),
         ('Qualitative', [
            'Pastel1', 'Pastel2', 'Paired', 'Accent', 'Dark2', 'Set1', 'Set2', 'Set3', 'tab10', 'tab20', 'tab20b', 'tab20c']),
         ('Miscellaneous', [
            'flag', 'prism', 'ocean', 'gist_earth', 'terrain', 'gist_stern', 'gnuplot', 'gnuplot2', 'CMRmap', 'cubehelix', 'brg', 'gist_rainbow', 'rainbow', 'jet', 'turbo', 'nipy_spectral', 'gist_ncar'])]
def plot_color_gradients(cmap_category, cmap_list):
    print(cmap_category)
    print(cmap_list)
    for color in cmap_list:
        np.savetxt(color+'.txt', np.c_[plt.get_cmap(color)(np.linspace(0, 1, 256))],fmt='%f',delimiter='\t')
for cmap_category, cmap_list in cmaps:
    plot_color_gradients(cmap_category, cmap_list)
scicomap获取全部颜色:
import numpy as np
import matplotlib.pyplot as plt
import scicomap as sc
import numpy as np

sc_map = sc.SciCoMap()
typeList=sc_map.get_ctype()
print(typeList)
sc_dic=sc.get_cmap_dict()

for i in typeList:
    tdic=sc_dic[i]
    print('-----------------')
    for j in tdic.keys():
        color=tdic[j]
        np.savetxt(j+'.txt', np.c_[plt.get_cmap(color)(np.linspace(0, 1, 256))],fmt='%f',delimiter='\t')
        print(j)
两百组数据整理起来真真真真的巨累,希望大家该点赞的点赞,该在看的在看!!
file exchange:
Zhaoxu Liu (2022). 200 colormap (https://www.mathworks.com/matlabcentral/fileexchange/120088-200-colormap), MATLAB Central File Exchange. 检索来源 2022/11/6.

