Python的绘图库也允许用户创建优雅的图形,本章给大家介绍的是关于ggplot绘制画图的技巧,ggplot2建立在grid系统上,这个系统不支持纹理。需要额外创建一堆数据,再基于这些数据构建一个geom_path图层,盖在柱图上才可以进行各种绘制,下面给大家详细讲解下怎么使用ggplot绘图。
ggplot类是在plotnine中的,能够生成一个图形。
pip install pandas plotnine
csv文件加载到survs_df的数据框架:
ggplot(survs_df, aes(x='weight', y='hindfoot_length',
size = 'year')) + geom_point()
1、设置数据框
2、需要将数据框架转换成位置、颜色、大小等
3、显示实际图形元素
实例代码:
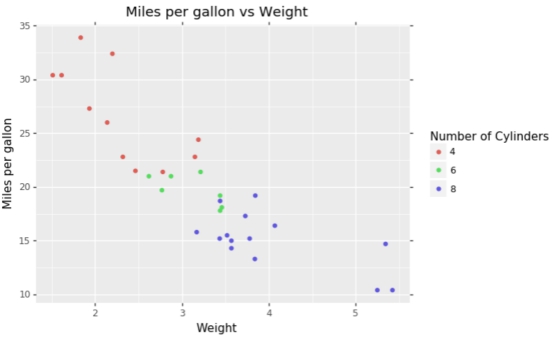
(ggplot(mtcars, aes(‘wt', ‘mpg', color='factor(cyl)'))
+ geom_point()
+ labs(title='Miles per gallon vs Weight', x='Weight', y='Miles per gallon')
+ guides(color=guide_legend(title='Number of Cylinders')) )
输出效果:
知识点扩展:
绘制散点图,geom_point()
读取外部数据进行绘图
>>> import pandas as pd
>>> from ggplot import *
>>> df=pd.read_table('C:\Users\lenovo\Desktop\mtcars.txt')
>>> df
··name type number volume size other
0 td T 96 3 20 c
1 sf F 87 5 65 c
2 cc F 79 9 80 d
如果读取的数据没有column可以添加
df.columns=['name','type','number','volume','size','other']
>>> p=ggplot(df, aes(x='number', y='volume', size='factor(size)', color='factor(other)'))+geom_point()
>>> print p

