vue项目中openlayers画行政区划(区域范围),供大家参考,具体内容如下
原理
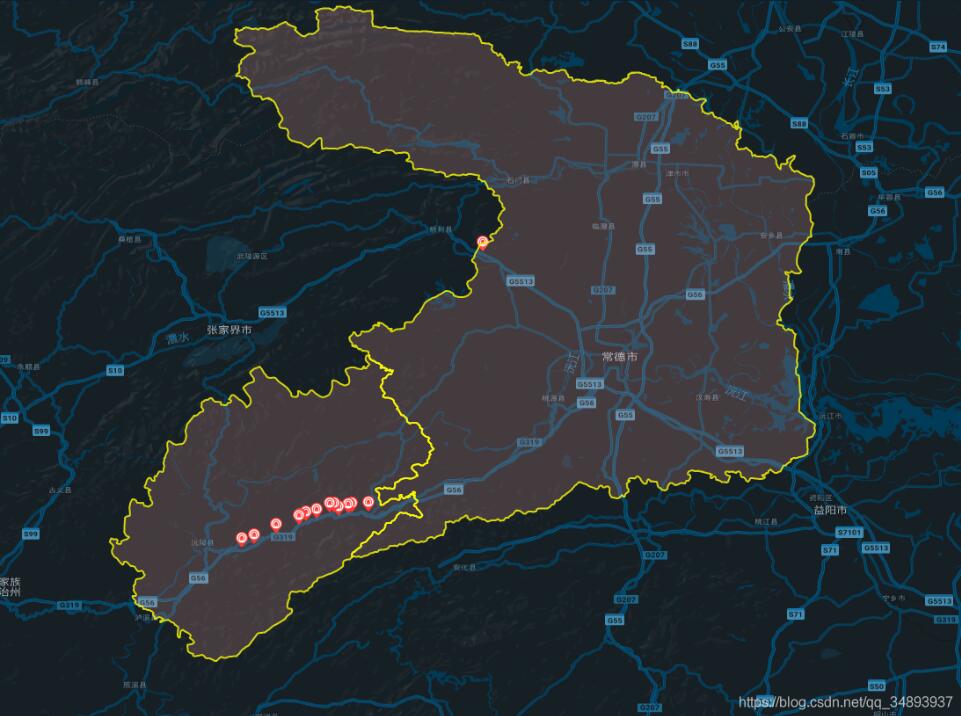
在地图上画需要的范围,实际上就是在地图上打上一圈点,然后依次将这些点用线连接,就形成了范围
引用相应的ol模块
import VectorLayer from 'ol/layer/Vector'
import VectorSource from 'ol/source/Vector'
import { Map, View, Feature } from 'ol'
import { Style, Icon, Stroke } from 'ol/style'
import { Point, LineString, Polygon } from 'ol/geom'
获取范围点
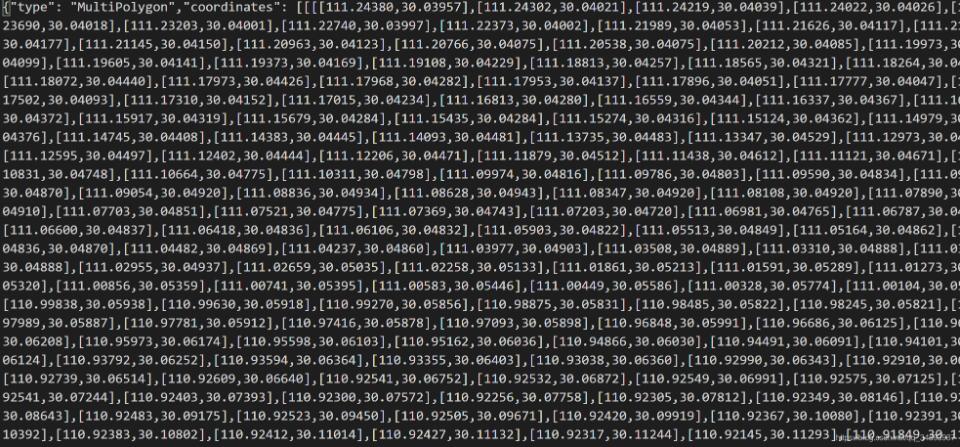
这里我将点放在json文件中,然后通过axios读取
json文件截图:
axios.get('static/常德市.json').then((res) => {
 let arr = res.data.coordinates
 let polygonFeature = new Feature({
   type: 'polygon',
   geometry: new Polygon(arr[0])
  })
  polygonFeature.setStyle(new Style({
   stroke: new Stroke({
   width: 2,

   color: [255, 255, 0, 0.8]
   }),
   fill: new Fill({
   color: [248, 172, 166, 0.2]
   })
   // text: new Text({
   // text: '这是区域'
   // })
  }))
  let polygonLayer = new VectorLayer({
   source: new VectorSource({
   features: [polygonFeature]
   })
  })
  this.gmap.addLayer(polygonLayer)
  })
  axios.get('static/怀化市沅陵县.json').then((res) => {
  let arr = res.data.coordinates
  let polygonFeature = new Feature({
   type: 'polygon',
   geometry: new Polygon(arr[0])
  })
  polygonFeature.setStyle(new Style({
   stroke: new Stroke({
   width: 2,
   color: [255, 255, 0, 0.8]
   }),
   fill: new Fill({
   color: [248, 172, 166, 0.2]
   })
   // text: new Text({
   // text: '这是区域'
   // })
  }))
  let polygonLayer = new VectorLayer({
   source: new VectorSource({
   features: [polygonFeature]
   })
  })
  this.gmap.addLayer(polygonLayer)
  })