经度 phi,纬度 theta 处的坐标为:
x =R* cos(phi) * cos(theta)
y = Rsin(phi) * cos(theta)
z = Rsin(theta)
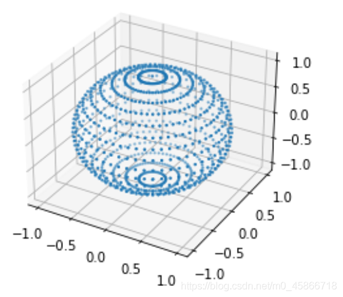
经纬度采样的采样点是相同经纬度间隔的交点。但是采样1000个点,如何划分多少条经线,多少条纬线相交,才能使1000个采样点最均匀的分布在球面上(虽然经纬度采样本来就不均匀,但对于不同的采样点个数应该有一种相对最均匀的经纬线划分)?求大佬指教!
我目前是将纬度每10度进行划分。
import random
from mpl_toolkits import mplot3d
import numpy as np
import math
import matplotlib.pyplot as plt
%matplotlib inline
ax=plt.axes(projection="3d")

N=1000
x=[]
y=[]
z=[]
r=1


#经度
def longitude(lng):
  phi=(180+lng)*(math.pi/180)
  return phi

#纬度
def latitude(lat):
  theta=lat*(math.pi/180)
  return theta

for i in range(-80,90,10):
  for j in np.arange(-180,180,360/((N-2)/17)):
    #x.append(-r*math.sin(latitude(i))*math.cos(longitude(j)))
    #y.append(r*math.cos(latitude(i)))
    #z.append(r*math.sin(latitude(i))*math.sin(longitude(j)))

    x.append(r*math.cos(latitude(i))*math.cos(longitude(j)))
    z.append(r*math.sin(latitude(i)))
    y.append(r*math.cos(latitude(i))*math.sin(longitude(j)))

x.append(r*math.cos(latitude(-90))*math.cos(longitude(0)))
z.append(r*math.sin(latitude(-90)))
y.append(r*math.cos(latitude(-90))*math.sin(longitude(0)))

x.append(r*math.cos(latitude(90))*math.cos(longitude(0)))
z.append(r*math.sin(latitude(90)))
y.append(r*math.cos(latitude(90))*math.sin(longitude(0)))

xline=np.array(x)
yline=np.array(y)
zline=np.array(z)
print(xline.shape)
ax.scatter3D(xline,yline,zline,s=2)
plt.savefig("D:\\samples\\经纬度采样.png")
效果