样式是定义图表可视化外观的配置,它由一组预置的rcParams参数构成。matplotlib预置了一系列样式风格,可直接使用。
样式相关模块为style。
matplotlib.style.available返回本机可用样式的列表。
列表只读,样式更新后,需要使用reload_library()重新加载样式。
In [1]: import matplotlib.style as style
In [2]: style.available
Out[2]:
['Solarize_Light2',
 '_classic_test_patch',
 'bmh',
 'classic',
 'dark_background',
 'fast',
 'fivethirtyeight',
 'ggplot',
 'grayscale',
 'seaborn',
 'seaborn-bright',
 'seaborn-colorblind',
 'seaborn-dark',
 'seaborn-dark-palette',
 'seaborn-darkgrid',
 'seaborn-deep',
 'seaborn-muted',
 'seaborn-notebook',
 'seaborn-paper',
 'seaborn-pastel',
 'seaborn-poster',
 'seaborn-talk',
 'seaborn-ticks',
 'seaborn-white',
 'seaborn-whitegrid',
 'tableau-colorblind10']
matplotlib.style.library以字典的形式返回所有样式的定义,字典键为样式名称,键为定义样式的 RcParams对象。
字典对象也是只读的,更新样式后,需要使用reload_library()重新加载样式。
In [6]: style.library['fast']
Out[6]:
RcParams({'agg.path.chunksize': 10000,
     'path.simplify': True,
     'path.simplify_threshold': 1.0})
matplotlib.style.reload_library()重新加载样式。
matplotlib.style.use(style)将matplotlib的绘图样式设置为某种样式。
使用default样式可以将样式为恢复到默认样式。
该函数只会更新style中定义的rcParams配置,其余rcParams配置保持不变。
参数style有四种取值:
str:样式名称或者样式文件的路径/url。通过style.available查看可用的样式名称。dict:以rcParams配置项和值为键值对的字典。Path:指向样式文件的Path对象。list:样式支持组合使用,将多个样式配置配置放置在列表中,matplotlib将逐个执行列表中每个元素的配置,元素可以为str、Path或者dict,列表右边的元素会覆盖前面元素的配置。import matplotlib.pyplot as plt plt.bar([1,2,3],[1,2,3]) plt.show()
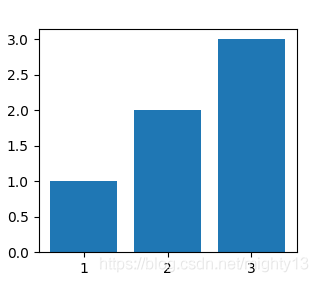
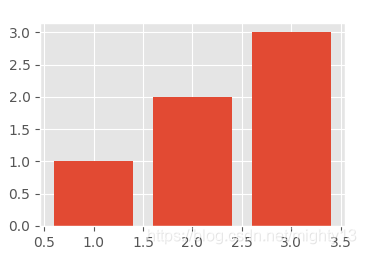
import matplotlib.pyplot as plt
plt.style.use('ggplot')
plt.bar([1,2,3],[1,2,3])
plt.show()
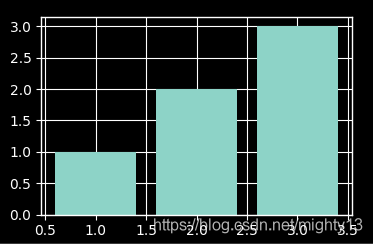
import matplotlib.pyplot as plt
plt.style.use(['ggplot','dark_background'])
plt.bar([1,2,3],[1,2,3])
plt.show()
import matplotlib.pyplot as plt
plt.subplot(221)
plt.bar([1,2,3],[1,2,3])
plt.style.use('ggplot')
plt.subplot(222)
plt.bar([1,2,3],[1,2,3])
plt.style.use('grayscale')
plt.subplot(223)
plt.bar([1,2,3],[1,2,3])
plt.style.use(['ggplot','grayscale'])
plt.subplot(224)
plt.bar([1,2,3],[1,2,3])
plt.show()
参见https://matplotlib.org/gallery/style_sheets/style_sheets_reference.html
https://matplotlib.org/tutorials/introductory/customizing.html

