
## 图文简介
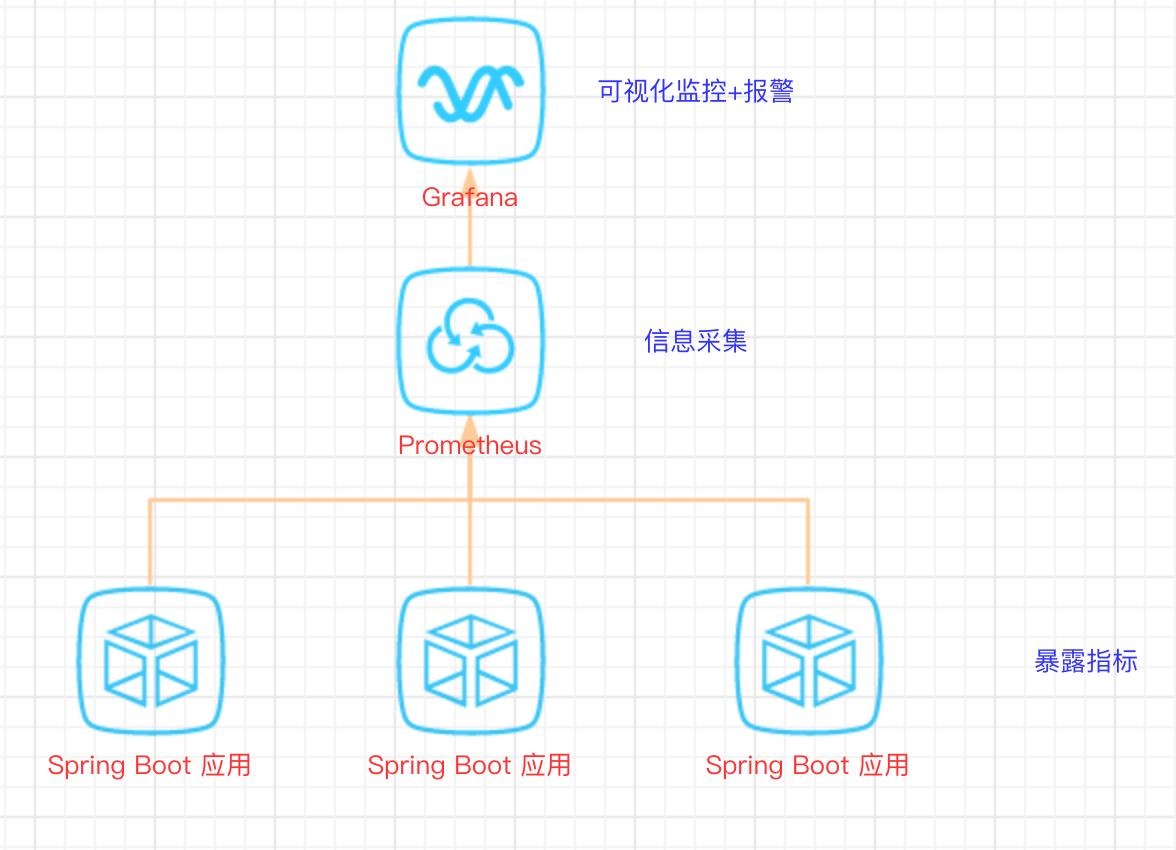
## 快速开始
#### 1、Spring Boot 应用暴露监控指标【版本 1.5.7.RELEASE】
首先,添加依赖如下依赖:
```
org.springframework.boot
spring-boot-starter-actuator
io.prometheus
simpleclient_spring_boot
0.0.26
```
然后,在启动类 `Application.java` 添加如下注解:
```
@SpringBootApplication
@EnablePrometheusEndpoint
@EnableSpringBootMetricsCollector
public class Application {
public static void main(String[] args) {
SpringApplication.run(Application.class, args);
}
}
```
最后,配置默认的登录账号和密码,在 `application.yml` 中:
```
security:
user:
name: user
password: pwd
```
> 提示:不建议配置 `management.security.enabled: false`
启动应用程序后,会看到如下一系列的 `Mappings`
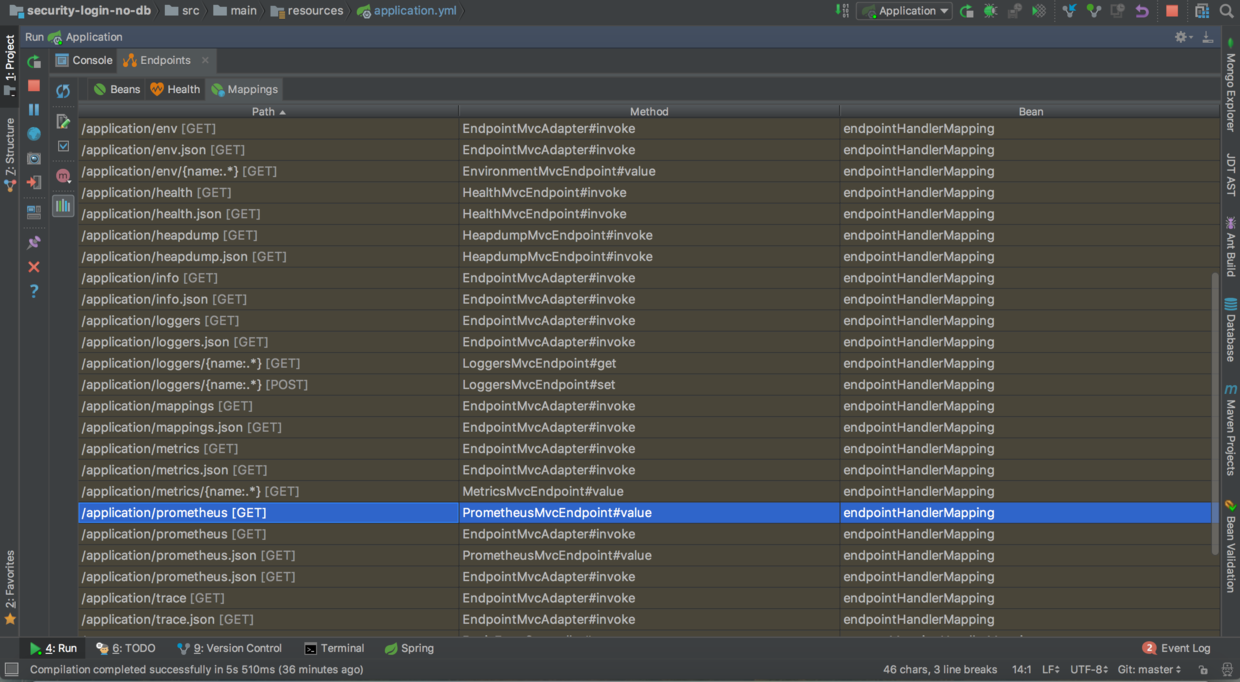
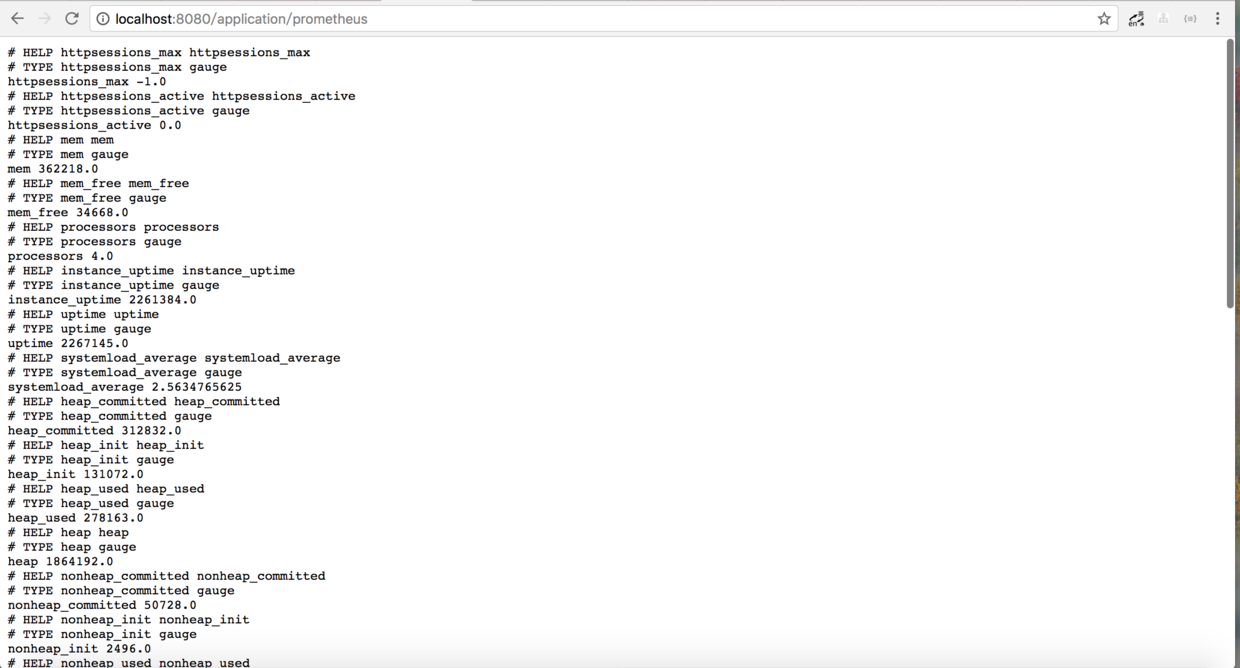
利用账号密码访问 http://localhost:8080/application/prometheus ,可以看到 Prometheus 格式的指标数据
#### 2、Prometheus 采集 Spring Boot 指标数据
首先,获取 Prometheus 的 Docker 镜像:
```
$ docker pull prom/prometheus
```
然后,编写配置文件 `prometheus.yml` :
```
global:
scrape_interval: 10s
scrape_timeout: 10s
evaluation_interval: 10m
scrape_configs:
- job_name: spring-boot
scrape_interval: 5s
scrape_timeout: 5s
metrics_path: /application/prometheus
scheme: http
basic_auth:
username: user
password: pwd
static_configs:
- targets:
- 127.0.0.1:8080 #此处填写 Spring Boot 应用的 IP + 端口号
```
接着,启动 Prometheus :
```
$ docker run -d \
--name prometheus \
-p 9090:9090 \
-m 500M \
-v "$(pwd)/prometheus.yml":/prometheus.yml \
-v "$(pwd)https://img.qb5200.com/download-x/data":https://img.qb5200.com/download-x/data \
prom/prometheus \
-config.file=/prometheus.yml \
-log.level=info
```
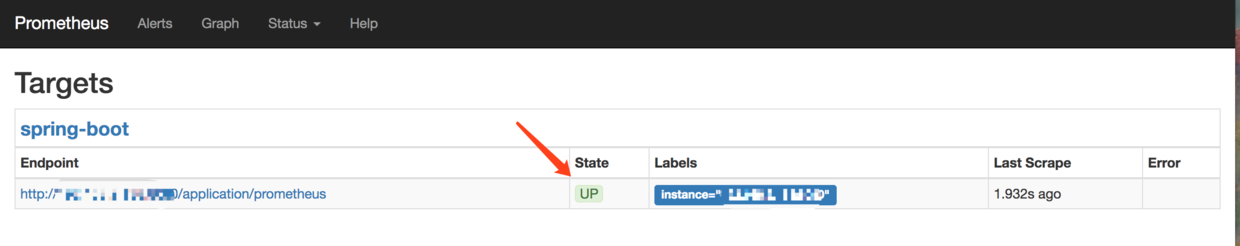
最后,访问 http://localhost:9090/targets , 检查 Spring Boot 采集状态是否正常。
#### 3、Grafana 可视化监控数据
首先,获取 Grafana 的 Docker 镜像:
```
$ docker pull grafana/grafana
```
然后,启动 Grafana:
```
$ docker run --name grafana -d -p 3000:3000 grafana/grafana
```
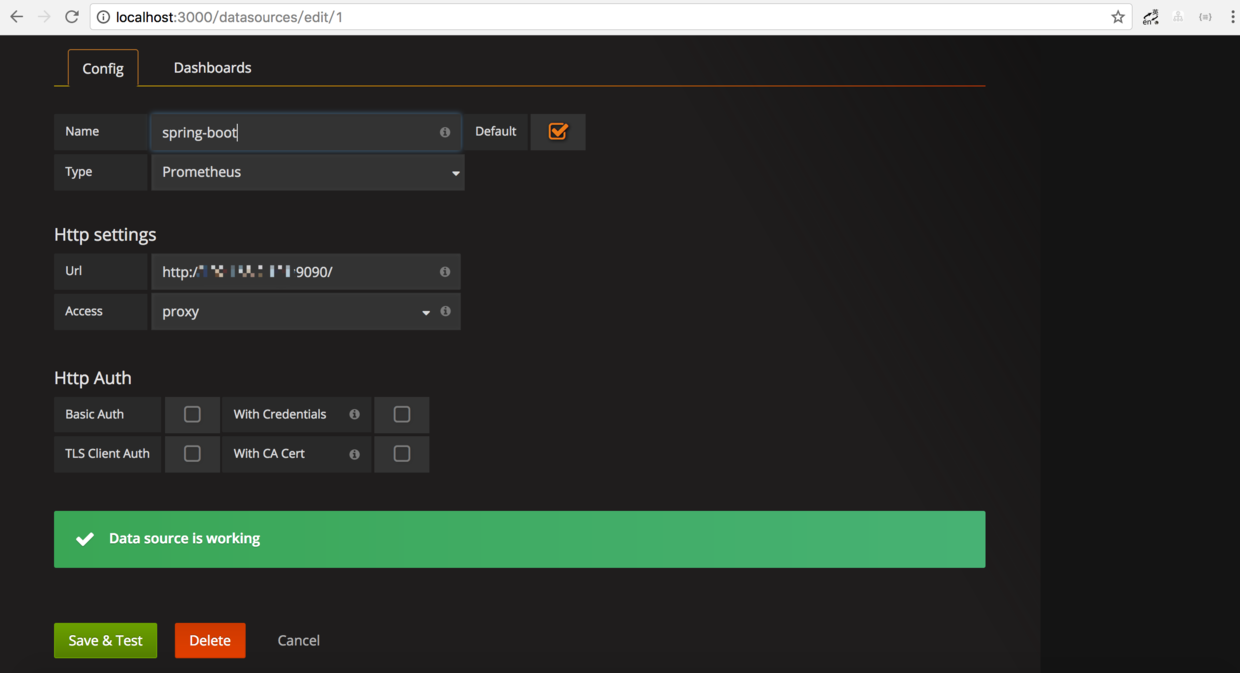
接着,访问 http://localhost:3000/ 配置 Prometheus 数据源:
> Grafana 登录账号 admin 密码 admin
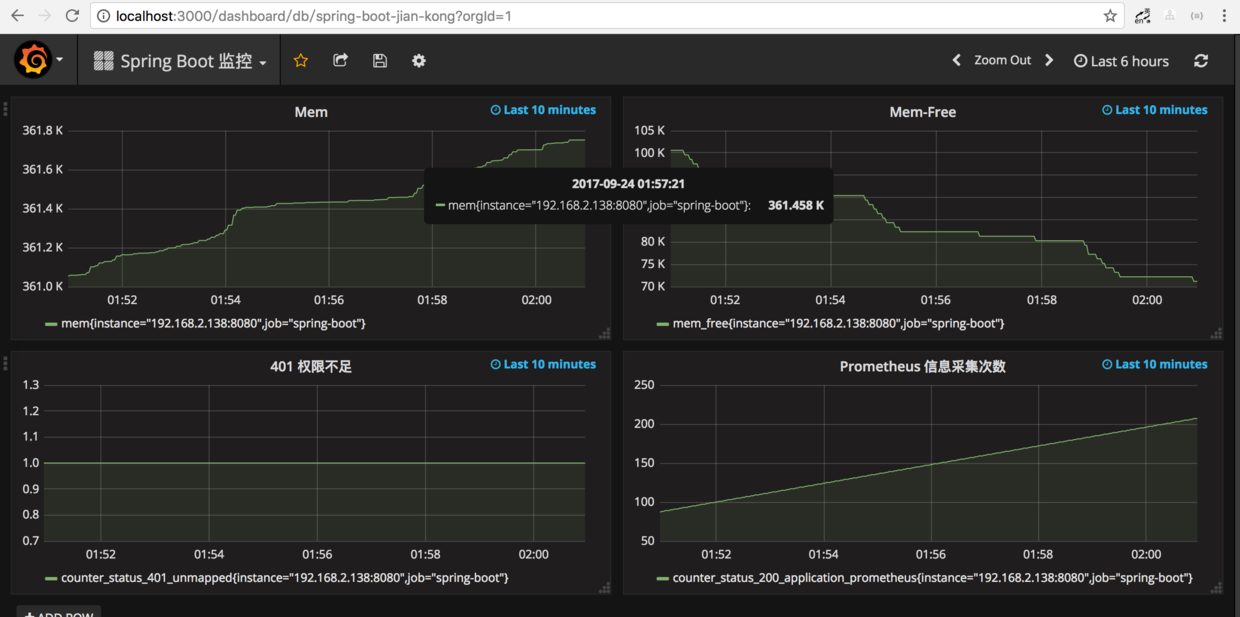
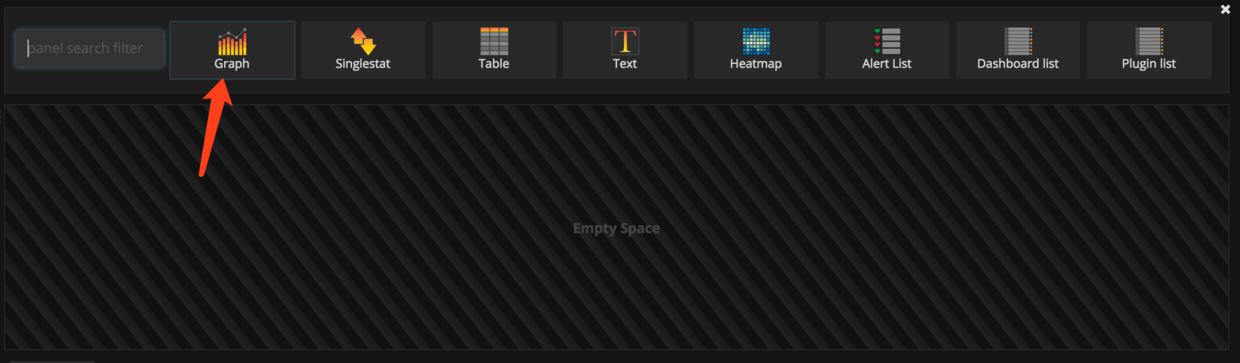
最后,配置单个指标的可视化监控面板:
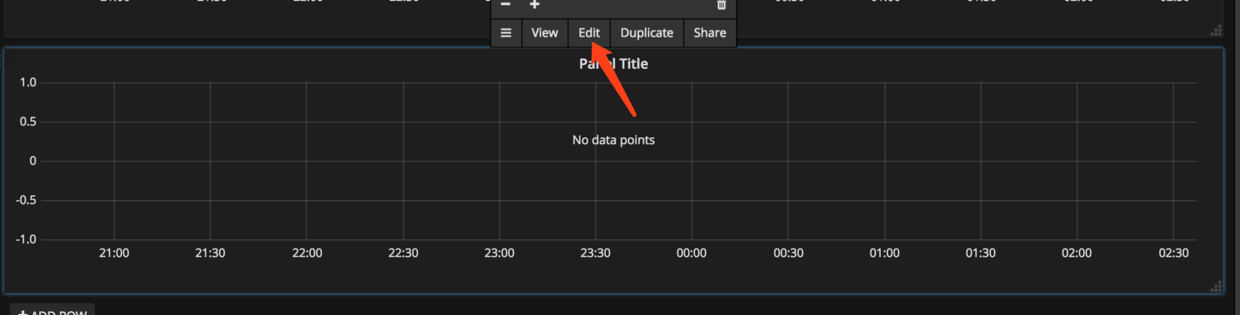
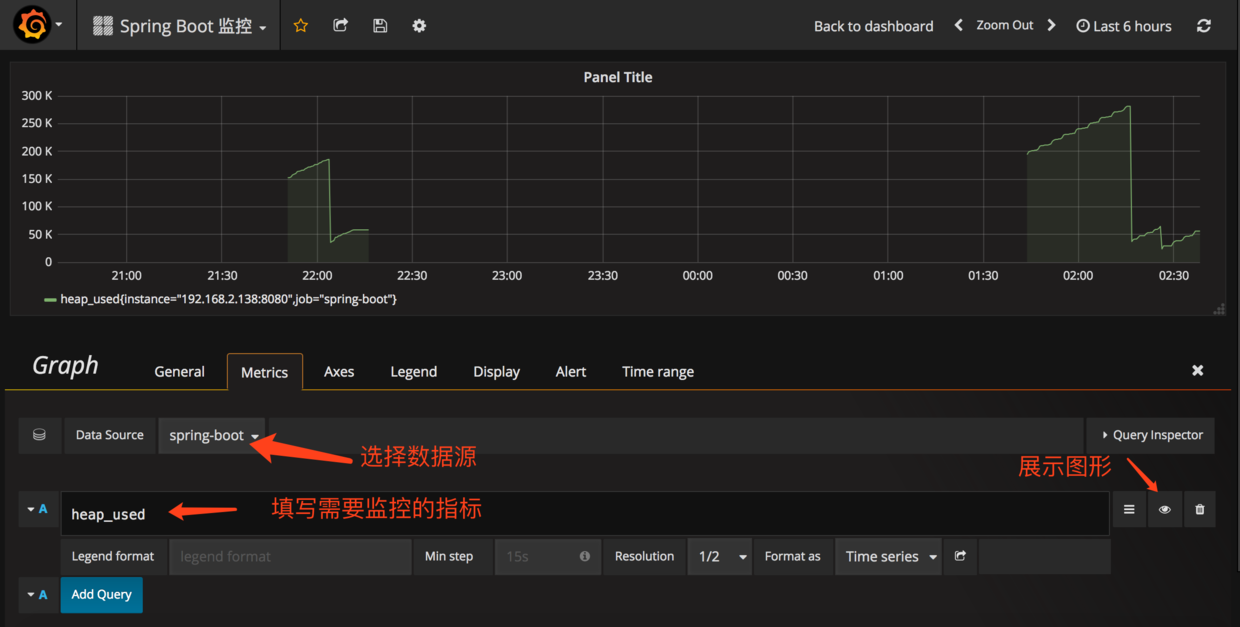
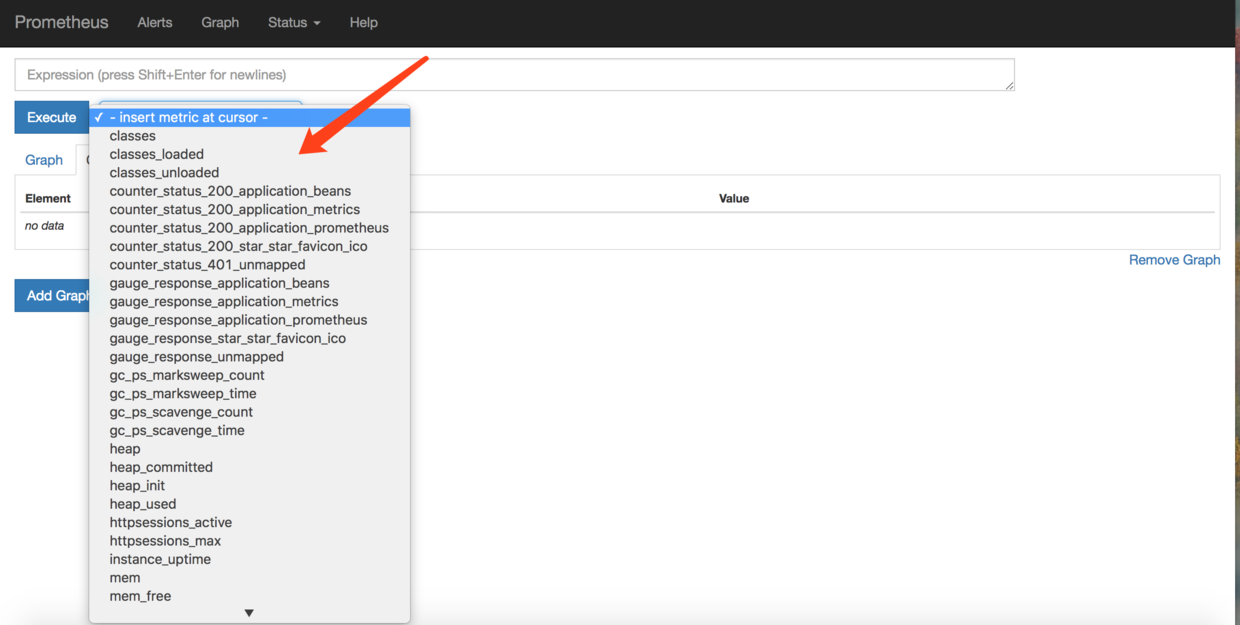
提示,此处不能任意填写,只能填已有的指标点,具体的可以在 Prometheus 的首页看到,即 http://localhost:9090/graph
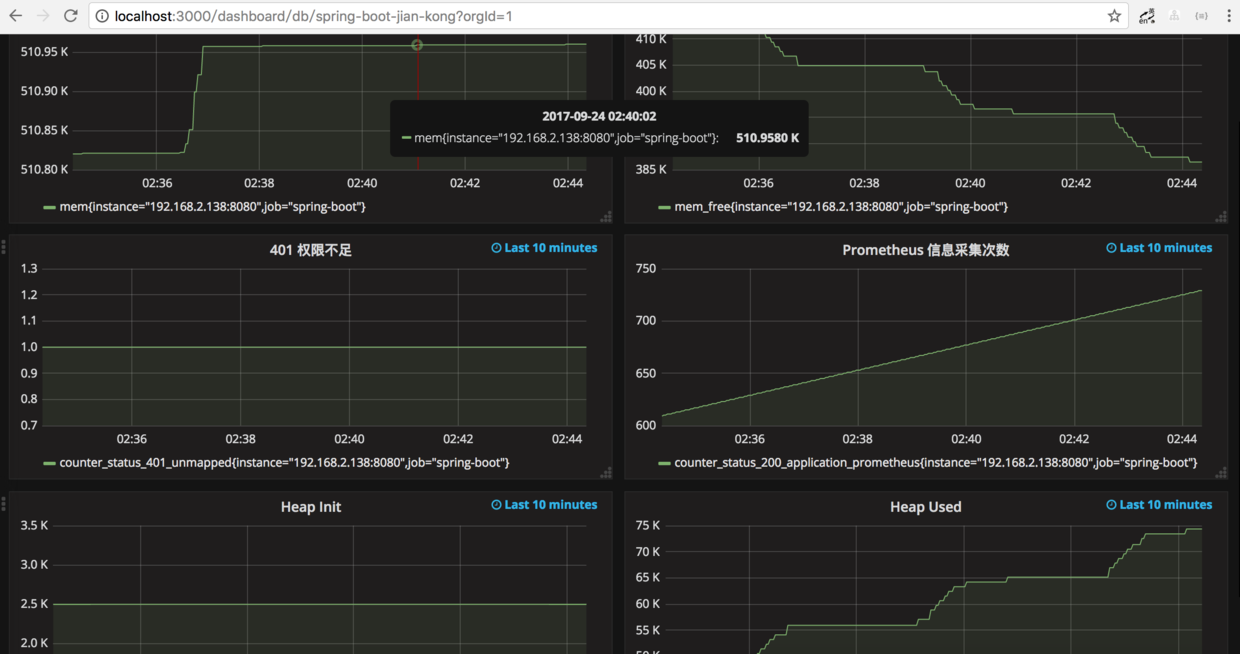
多配置几个指标之后,即可有如下效果:
## 参考文档
- [prometheus 官方文档](http://prometheus.iohttps://img.qb5200.com/download-x/docs/introduction/overview/)
- [Grafana Docker 安装](http:/https://img.qb5200.com/download-x/docs.grafana.org/installationhttps://img.qb5200.com/download-x/docker/)
- [Spring Boot 官方文档](http://projects.spring.io/spring-boot/)
## 文末福利
Java 资料大全 链接:http://pan.baidu.com/s/1pUCCPstPnlGDCljtBVUsXQ 密码:b2xc
更多资料: 2020 年 精选阿里 Java、架构、微服务精选资料等,加 v ❤ :qwerdd111
> 转载,请保留原文地址,谢谢 ~

