# 前言
写一手漂亮的代码,何谓漂亮的代码?对我来说大概有这么几点:
1. 写法符合规范(如:该空格的地方打上空格,该换行的地方换行,名命方式符合规范等等)
2. 简洁且可读性高(能十行代码实现并且让人容易看懂的绝不写十一行,对经常重复出现的代码段落进行封装)
3. 性能高(如:运行时间尽可能短,运行时所用内存尽可能少)
要实现以上目标,自然就要对代码进行优化,说到代码的优化,自然而然就会想到对算法时间复杂度进行优化,比如我要实现一个在有序数组中查找一个数,最容易想到的就是遍历一遍 O(n) 的复杂度,优化一下自然是使用二分, O(logn) 的复杂度。如果这段代码在我们的程序中会经常被调用,那么,通过这算法上的优化,我们的程序性能自然而然的会有很高的提升。
但是,有时候会发现,已经对算法进行优化了,程序的性能(如运行时间、内存占用等)仍然不能达到预期,那么,这时候该如何对我们的代码进行进一步的优化呢?
*这篇文章将以 Python 为例进行介绍*
# 先来段代码
这里,我将通过使用 Julia 分形的代码来进行。
> Julia 集合,由式 $f_c(z) = z ^2 + c$ 进行反复迭代到。
>
> 对于固定的复数 c ,取某一 z 值,可以得到序列
>
> $z_0, f_c(z_0), f_c(f_c(z_0)), ...$
>
> 这一序列可能发散于无穷大或处于某一范围之内并收敛于某一值,我们将使其不扩散的 z 值的集合称为朱利亚集合。
```python
import time
import numpy as np
import imageio
import PIL
import matplotlib.pyplot as plt
import cv2 as cv
x1, x2, y1, y2 = -1.8, 1.8, -1.8, 1.8
c_real, c_imag = -0.62772, -0.42193
def calculate_z_serial_purepython(maxiter, zs, cs):
output = [0] * len(zs)
for i in range(len(zs)):
n = 0
z = zs[i]
c = cs[i]
while abs(z) < 2 and n < maxiter:
z = z * z + c
n += 1
output[i] = n
return output
def calc_pure_python(desired_width, max_itertions):
x_step = (float(x2 - x1)) / float(desired_width)
y_step = (float(y2 - y1)) / float(desired_width)
x, y = [], []
ycoord = y1
while ycoord < y2:
y.append(ycoord)
ycoord += y_step
xcoord = x1
while xcoord < x2:
x.append(xcoord)
xcoord += x_step
zs, cs = [], []
for ycoord in y:
for xcoord in x:
zs.append(complex(xcoord, ycoord))
cs.append(complex(c_real, c_imag))
print(f"Length of x: {len(x)}")
print(f"Total elements: {len(zs)}")
start_time = time.time()
output = calculate_z_serial_purepython(max_itertions, zs, cs)
end_time = time.time()
secs = end_time - start_time
print("calculate_z_serial_purepython took", secs, "seconds")
assert sum(output) == 33219980
# # show img
# output = np.array(output).reshape(desired_width, desired_width)
# plt.imshow(output, cmap='gray')
# plt.savefig("julia.png")
if __name__ == "__main__":
calc_pure_python(desired_width=1000, max_itertions=300)
```
这段代码运行完,可以得到图片
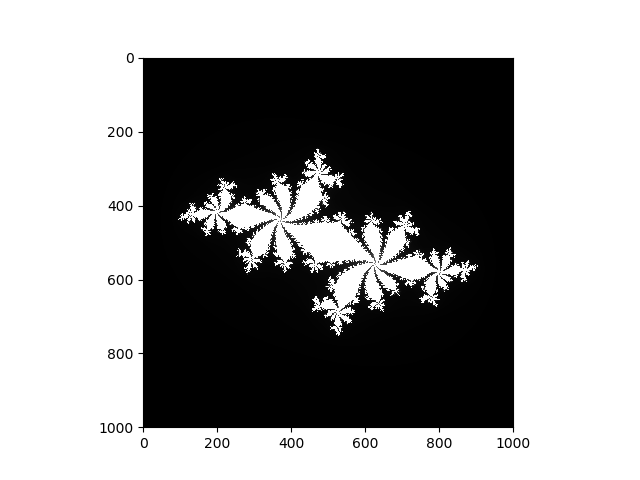
运行结果
```
Length of x: 1000
Total elements: 1000000
calculate_z_serial_purepython took 25.053941249847412 seconds
```
# 开始分析
这里,将通过各种方法来对这段代码的运行时间来进行分析
## 直接打印运行时间
在前面的代码中,我们可以看到有 start_time 和 end_time 两个变量,通过 print 两个变量的差值即可得到运行时间,但是,每次想要打印运行时间都得加那么几行代码就会很麻烦,此时我们可以通过使用修饰器来进行
```python
from functools import wraps
def timefn(fn):
@wraps(fn)
def measure_time(*args, **kwargs):
start_time = time.time()
result = fn(*args, **kwargs)
end_time = time.time()
print("@timefn:" + fn.__name__ + " took " + str(end_time - start_time), " seconds")
return result
return measure_time
```
然后对 calculate_z_serial_purepython 函数进行测试
```python
@timefn
def calculate_z_serial_purepython(maxiter, zs, cs):
...
```
运行后输出结果
```
Length of x: 1000
Total elements: 1000000
@timefn:calculate_z_serial_purepython took 26.64286208152771 seconds
calculate_z_serial_purepython took 26.64286208152771 seconds
```
另外,也可以在命令行中输入
```
python -m timeit -n 5 -r 5 -s "import code" "code.calc_pure_python(desired_width=1000, max_itertions=300)"
```
其中 `-n 5` 表示循环次数, `-r 5` 表示重复次数,timeit 会对语句循环执行 n 次,并计算平均值作为一个结果,重复 r 次选出最好的结果。
```
5 loops, best of 5: 24.9 sec per loop
```
## UNIX tine 命令
由于电脑上没有 Linux 环境,于是使用 WSL 来进行
```
time -p python code.py
如果是 Linux 中进行,可能命令需改成
/usr/bin/time -p python code.py
```
输出结果
```
Length of x: 1000
Total elements: 1000000
@timefn:calculate_z_serial_purepython took 14.34933090209961 seconds
calculate_z_serial_purepython took 14.350624322891235 seconds
real 15.57
user 15.06
sys 0.40
```
其中 real 记录整体耗时, user 记录了 CPU 花在任务上的时间,sys 记录了内核函数耗费的时间
```
/usr/bin/time --verbose python code.py
```
输出,WSL 的 time 命令里面没有 --verbose 这个参数,只能到服务器里面试了,突然觉得我的笔记本跑的好慢。。。
```
Length of x: 1000
Total elements: 1000000
@timefn:calculate_z_serial_purepython took 7.899603605270386 seconds
calculate_z_serial_purepython took 7.899857997894287 seconds
Command being timed: "python code.py"
User time (seconds): 8.33
System time (seconds): 0.08
Percent of CPU this job got: 98%
Elapsed (wall clock) time (h:mm:ss or m:ss): 0:08.54
Average shared text size (kbytes): 0
Average unshared data size (kbytes): 0
Average stack size (kbytes): 0
Average total size (kbytes): 0
Maximum resident set size (kbytes): 98996
Average resident set size (kbytes): 0
Major (requiring I/O) page faults: 0
Minor (reclaiming a frame) page faults: 25474
Voluntary context switches: 0
Involuntary context switches: 2534
Swaps: 0
File system inputs: 0
File system outputs: 0
Socket messages sent: 0
Socket messages received: 0
Signals delivered: 0
Page size (bytes): 4096
Exit status: 0
```
这里面需要关心的参数是 `Major (requiring I/O) page faults` ,表示操作系统是否由于 RAM 中的数据不存在而需要从磁盘上读取页面。
## cProfile 模块
cProfile 模块是标准库内建三个的分析工具之一,另外两个是 hotshot 和 profile。
```
python -m cProfile -s cumulative code.py
```
-s cumulative 表示对每个函数累计花费的时间进行排序
输出
```
36222017 function calls in 30.381 seconds
Ordered by: cumulative time
ncalls tottime percall cumtime percall filename:lineno(function)
1 0.000 0.000 30.381 30.381 {built-in method builtins.exec}
1 0.064 0.064 30.381 30.381 code.py:1(
)
1 1.365 1.365 30.317 30.317 code.py:35(calc_pure_python)
1 0.000 0.000 28.599 28.599 code.py:13(measure_time)
1 19.942 19.942 28.598 28.598 code.py:22(calculate_z_serial_purepython)
34219980 8.655 0.000 8.655 0.000 {built-in method builtins.abs}
2002000 0.339 0.000 0.339 0.000 {method 'append' of 'list' objects}
1 0.012 0.012 0.012 0.012 {built-in method builtins.sum}
4 0.003 0.001 0.003 0.001 {built-in method builtins.print}
1 0.000 0.000 0.000 0.000 code.py:12(timefn)
1 0.000 0.000 0.000 0.000 functools.py:44(update_wrapper)
4 0.000 0.000 0.000 0.000 {built-in method time.time}
1 0.000 0.000 0.000 0.000 :989(_handle_fromlist)
4 0.000 0.000 0.000 0.000 {built-in method builtins.len}
7 0.000 0.000 0.000 0.000 {built-in method builtins.getattr}
1 0.000 0.000 0.000 0.000 {built-in method builtins.hasattr}
5 0.000 0.000 0.000 0.000 {built-in method builtins.setattr}
1 0.000 0.000 0.000 0.000 functools.py:74(wraps)
1 0.000 0.000 0.000 0.000 {method 'update' of 'dict' objects}
1 0.000 0.000 0.000 0.000 {method 'disable' of '_lsprof.Profiler' objects}
```
可以看到,在代码的入口处总共花费了 30.381 秒,ncalls 为 1,表示只执行了 1 次,然后 calculate_z_serial_purepython 花费了 28.598 秒,可以推断出调用该函数使用了近 2 秒。另外可以看到,abs 函数被调用了 34219980 次。对列表项的 append 操作进行了 2002000 次(1000 * 1000 * 2 +1000 * 2 )。
接下来,我们进行更深入的分析。
```
python -m cProfile -o profile.stats code.py
```
先生成一个统计文件,然后在 python 中进行分析
```
>>> import pstats
>>> p = pstats.Stats("profile.stats")
>>> p.sort_stats("cumulative")
>>> p.print_stats()
Sat Apr 25 16:38:07 2020 profile.stats
36222017 function calls in 30.461 seconds
Ordered by: cumulative time
ncalls tottime percall cumtime percall filename:lineno(function)
1 0.000 0.000 30.461 30.461 {built-in method builtins.exec}
1 0.060 0.060 30.461 30.461 code.py:1()
1 1.509 1.509 30.400 30.400 code.py:35(calc_pure_python)
1 0.000 0.000 28.516 28.516 code.py:13(measure_time)
1 20.032 20.032 28.515 28.515 code.py:22(calculate_z_serial_purepython)
34219980 8.483 0.000 8.483 0.000 {built-in method builtins.abs}
2002000 0.360 0.000 0.360 0.000 {method 'append' of 'list' objects}
1 0.012 0.012 0.012 0.012 {built-in method builtins.sum}
4 0.004 0.001 0.004 0.001 {built-in method builtins.print}
1 0.000 0.000 0.000 0.000 code.py:12(timefn)
1 0.000 0.000 0.000 0.000 C:\Users\ITryagain\AppData\Local\conda\conda\envs\tensorflow-gpu\lib\functools.py:44(update_wrapper)
4 0.000 0.000 0.000 0.000 {built-in method time.time}
1 0.000 0.000 0.000 0.000 :989(_handle_fromlist)
7 0.000 0.000 0.000 0.000 {built-in method builtins.getattr}
1 0.000 0.000 0.000 0.000 {built-in method builtins.hasattr}
4 0.000 0.000 0.000 0.000 {built-in method builtins.len}
1 0.000 0.000 0.000 0.000 C:\Users\ITryagain\AppData\Local\conda\conda\envs\tensorflow-gpu\lib\functools.py:74(wraps)
1 0.000 0.000 0.000 0.000 {method 'update' of 'dict' objects}
5 0.000 0.000 0.000 0.000 {built-in method builtins.setattr}
1 0.000 0.000 0.000 0.000 {method 'disable' of '_lsprof.Profiler' objects}
```
这里,就生成了与上面一致的信息
```
>>> p.print_callers()
Ordered by: cumulative time
Function was called by...
ncalls tottime cumtime
{built-in method builtins.exec} <-
code.py:1() <- 1 0.060 30.461 {built-in method builtins.exec}
code.py:35(calc_pure_python) <- 1 1.509 30.400 code.py:1()
code.py:13(measure_time) <- 1 0.000 28.516 code.py:35(calc_pure_python)
code.py:22(calculate_z_serial_purepython) <- 1 20.032 28.515 code.py:13(measure_time)
{built-in method builtins.abs} <- 34219980 8.483 8.483 code.py:22(calculate_z_serial_purepython)
{method 'append' of 'list' objects} <- 2002000 0.360 0.360 code.py:35(calc_pure_python)
{built-in method builtins.sum} <- 1 0.012 0.012 code.py:35(calc_pure_python)
{built-in method builtins.print} <- 1 0.000 0.000 code.py:13(measure_time)
3 0.003 0.003 code.py:35(calc_pure_python)
code.py:12(timefn) <- 1 0.000 0.000 code.py:1()
C:\Users\ITryagain\AppData\Local\conda\conda\envs\tensorflow-gpu\lib\functools.py:44(update_wrapper) <- 1 0.000 0.000 code.py:12(timefn)
{built-in method time.time} <- 2 0.000 0.000 code.py:13(measure_time)
2 0.000 0.000 code.py:35(calc_pure_python)
:989(_handle_fromlist) <- 1 0.000 0.000 code.py:1()
{built-in method builtins.getattr} <- 7 0.000 0.000 C:\Users\ITryagain\AppData\Local\conda\conda\envs\tensorflow-gpu\lib\functools.py:44(update_wrapper)
{built-in method builtins.hasattr} <- 1 0.000 0.000 :989(_handle_fromlist)
{built-in method builtins.len} <- 2 0.000 0.000 code.py:22(calculate_z_serial_purepython)
2 0.000 0.000 code.py:35(calc_pure_python)
C:\Users\ITryagain\AppData\Local\conda\conda\envs\tensorflow-gpu\lib\functools.py:74(wraps) <- 1 0.000 0.000 code.py:12(timefn)
{method 'update' of 'dict' objects} <- 1 0.000 0.000 C:\Users\ITryagain\AppData\Local\conda\conda\envs\tensorflow-gpu\lib\functools.py:44(update_wrapper)
{built-in method builtins.setattr} <- 5 0.000 0.000 C:\Users\ITryagain\AppData\Local\conda\conda\envs\tensorflow-gpu\lib\functools.py:44(update_wrapper)
{method 'disable' of '_lsprof.Profiler' objects} <-
```
这里,我们可以看到,在每一行最后会有调用这部分的父函数名称,这样我们就可以定位到对某一操作最费时的那个函数。
我们还可以显示那个函数调用了其它函数
```
>>> p.print_callees()
Ordered by: cumulative time
Function called...
ncalls tottime cumtime
{built-in method builtins.exec} -> 1 0.060 30.461 code.py:1()
code.py:1() -> 1 0.000 0.000 :989(_handle_fromlist)
1 0.000 0.000 code.py:12(timefn)
1 1.509 30.400 code.py:35(calc_pure_python)
code.py:35(calc_pure_python) -> 1 0.000 28.516 code.py:13(measure_time)
2 0.000 0.000 {built-in method builtins.len}
3 0.003 0.003 {built-in method builtins.print}
1 0.012 0.012 {built-in method builtins.sum}
2 0.000 0.000 {built-in method time.time}
2002000 0.360 0.360 {method 'append' of 'list' objects}
code.py:13(measure_time) -> 1 20.032 28.515 code.py:22(calculate_z_serial_purepython)
1 0.000 0.000 {built-in method builtins.print}
2 0.000 0.000 {built-in method time.time}
code.py:22(calculate_z_serial_purepython) -> 34219980 8.483 8.483 {built-in method builtins.abs}
2 0.000 0.000 {built-in method builtins.len}
{built-in method builtins.abs} ->
{method 'append' of 'list' objects} ->
{built-in method builtins.sum} ->
{built-in method builtins.print} ->
code.py:12(timefn) -> 1 0.000 0.000 C:\Users\ITryagain\AppData\Local\conda\conda\envs\tensorflow-gpu\lib\functools.py:44(update_wrapper)
1 0.000 0.000 C:\Users\ITryagain\AppData\Local\conda\conda\envs\tensorflow-gpu\lib\functools.py:74(wraps)
C:\Users\ITryagain\AppData\Local\conda\conda\envs\tensorflow-gpu\lib\functools.py:44(update_wrapper) -> 7 0.000 0.000 {built-in method builtins.getattr}
5 0.000 0.000 {built-in method builtins.setattr}
1 0.000 0.000 {method 'update' of 'dict' objects}
{built-in method time.time} ->
:989(_handle_fromlist) -> 1 0.000 0.000 {built-in method builtins.hasattr}
{built-in method builtins.getattr} ->
{built-in method builtins.hasattr} ->
{built-in method builtins.len} ->
C:\Users\ITryagain\AppData\Local\conda\conda\envs\tensorflow-gpu\lib\functools.py:74(wraps) ->
{method 'update' of 'dict' objects} ->
{built-in method builtins.setattr} ->
{method 'disable' of '_lsprof.Profiler' objects} ->
```
## line_profiler 逐行分析
前面我们通过 cProfile 来对代码进行了整体的分析,当我们确定了耗时多的函数后,想对该函数进行进一步分析时,就可以使用 line_profiler 了。
先安装
```
pip install line_profiler
或
conda install line_profiler
```
在需要测试的函数前面加上修饰器 @profile,然后命令函输入
```
kernprof -l -v code.py
```
输出
```
Wrote profile results to code.py.lprof
Timer unit: 1e-07 s
Total time: 137.019 s
File: code.py
Function: calculate_z_serial_purepython at line 23
Line # Hits Time Per Hit % Time Line Contents
==============================================================
23 @profile
24 def calculate_z_serial_purepython(maxiter, zs, cs):
25 1 89776.0 89776.0 0.0 output = [0] * len(zs)
26 1000001 9990393.0 10.0 0.7 for i in range(len(zs)):
27 1000000 9244029.0 9.2 0.7 n = 0
28 1000000 10851654.0 10.9 0.8 z = zs[i]
29 1000000 10242762.0 10.2 0.7 c = cs[i]
30 34219980 558122806.0 16.3 40.7 while abs(z) < 2 and n < maxiter:
31 33219980 403539388.0 12.1 29.5 z = z * z + c
32 33219980 356918574.0 10.7 26.0 n += 1
33 1000000 11186107.0 11.2 0.8 output[i] = n
34 1 12.0 12.0 0.0 return output
```
运行时间比较长。。不过,这里可以发现,耗时的操作主要都在 while 循环中,做判断的耗时最长,但是这里我们并不知道是 abs(z) < 2 还是 n < maxiter 更花时间。z 与 n 的更新也比较花时间,这是因为在每次循环时, Python 的动态查询机制都在工作。
那么,这里可以通过 timeit 来进行测试
```
In [1]: z = 0 + 0j
In [2]: %timeit abs(z) < 2
357 ns ± 21.1 ns per loop (mean ± std. dev. of 7 runs, 1000000 loops each)
In [3]: n = 1
In [4]: maxiter = 300
In [5]: %timeit n < maxiter
119 ns ± 6.91 ns per loop (mean ± std. dev. of 7 runs, 10000000 loops each)
```
可以看到,n < maxiter 所需时间更短,并且每301次会有一次 False,而 abs(z) < 2 为 False 的次数我们并不好估计,占比约为前面图片中白色部分所占比例。因此,我们可以假设交换两条语句的顺序可以使得程序运行速度更快。
```
Total time: 132.816 s
File: code.py
Function: calculate_z_serial_purepython at line 23
Line # Hits Time Per Hit % Time Line Contents
==============================================================
23 @profile
24 def calculate_z_serial_purepython(maxiter, zs, cs):
25 1 83002.0 83002.0 0.0 output = [0] * len(zs)
26 1000001 9833163.0 9.8 0.7 for i in range(len(zs)):
27 1000000 9241272.0 9.2 0.7 n = 0
28 1000000 10667576.0 10.7 0.8 z = zs[i]
29 1000000 10091308.0 10.1 0.8 c = cs[i]
30 34219980 531157092.0 15.5 40.0 while n < maxiter and abs(z) < 2:
31 33219980 393275303.0 11.8 29.6 z = z * z + c
32 33219980 352964180.0 10.6 26.6 n += 1
33 1000000 10851379.0 10.9 0.8 output[i] = n
34 1 11.0 11.0 0.0 return output
```
可以看到,确实是有所优化。
# 小节
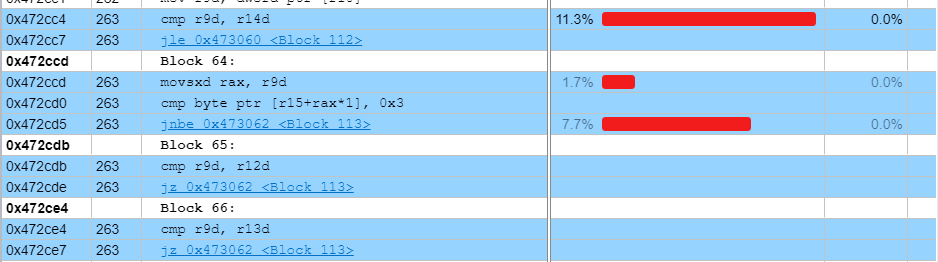
从开始学习编程到现在差不多快 3 年了,之前可以说是从来没有利用这些工具来对代码性能进行过分析,最多也只是通过算法复杂度的分析来进行优化,接触了这些之后就感觉,需要学习的东西还有很多。在近期进行的华为软挑中,队友也曾对代码(C++)的运行时间进行过分析,如下图。
下篇将介绍对运行时内存的分析。
# 参考
1. 《Python 高性能编程》

