开发工具:VS2017
语言:C#
DotNet版本:.Net FrameWork 4.0及以上
使用的DLL工具名称:GemBox.Spreadsheet.dll (版本:37.3.30.1185)
一、GemBox.Spreadsheet工具:
该DLL是由GemBox公司开发的基于Excel功能的开发工具,该DLL很轻量,且使用起来很方便,在这里推荐下来来使用。
下载地址:
http://xiazai.jb51.net/201712/yuanma/GemBox_Spreadsheet.zip
本文就是使用该工具进行Excel的写入操作。
二、创建Excel
为了能使用该DLL,必须在调用前写入以下代码:
SpreadsheetInfo.SetLicense("FREE-LIMITED-KEY");
创建Excel文件如下:
ExcelFile excel = new ExcelFile();
这里仅仅只是创建一个excel,代表的是excel整个文件,而保存该文件的代码如下:
excel.Save("文件路径");
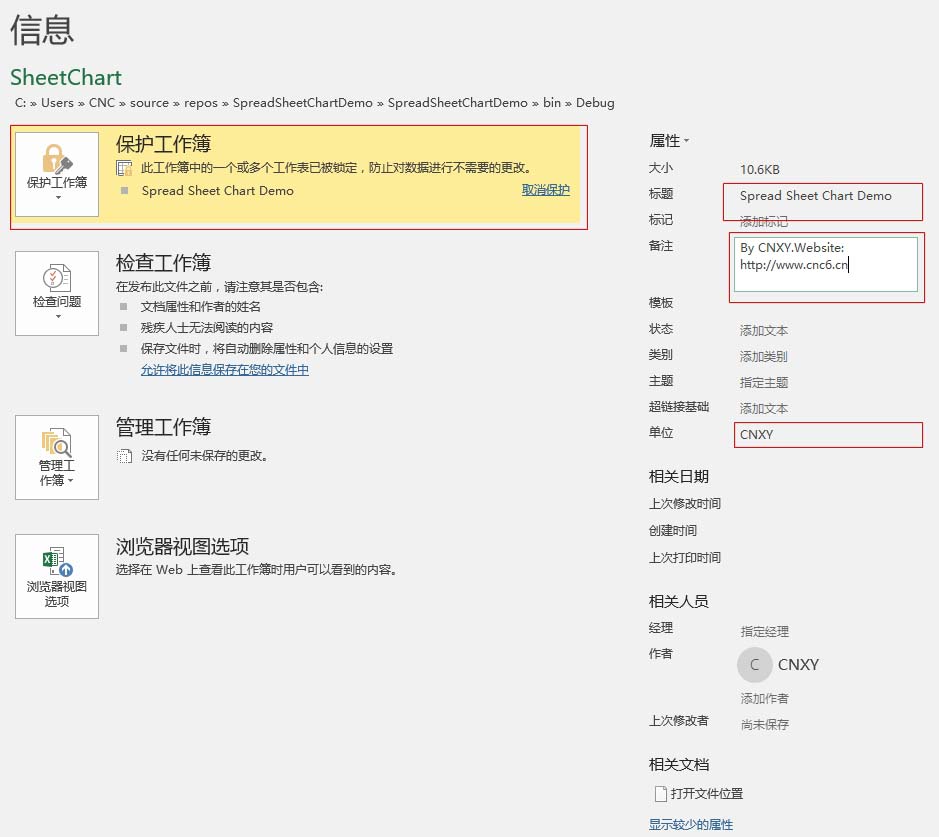
三、给Excel添加一些属性
我们可以给excel添加一些诸如文档标题、作者、公司及备注等内容,实现这些内容的代码如下:
excel.DocumentProperties.BuiltIn.Add(new KeyValuePair<BuiltInDocumentProperties, string>(BuiltInDocumentProperties.Title, TITLE));
excel.DocumentProperties.BuiltIn.Add(new KeyValuePair<BuiltInDocumentProperties, string>(BuiltInDocumentProperties.Author, "CNXY"));
excel.DocumentProperties.BuiltIn.Add(new KeyValuePair<BuiltInDocumentProperties, string>(BuiltInDocumentProperties.Company, "CNXY"));
excel.DocumentProperties.BuiltIn.Add(new KeyValuePair<BuiltInDocumentProperties, string>(BuiltInDocumentProperties.Comments, "By CNXY.Website: http://www.cnc6.cn"));
四、给excel默认字体
这是给整个Excel设置统一的字体,具体代码如下:
excel.DefaultFontName = "Times New Roman";
五、添加一个Sheet表格
要知道,Excel是由Sheet表格构成的,因此添加Sheet表格的代码如下:
ExcelWorksheet sheet = excel.Worksheets.Add("表格名称");
以上,已经在excel上添加了一个名为“表格名称”的数据表格。
六、给Sheet添加密码保护
有时候,为了保护自己的Excel不被篡改,需要设置一下Sheet的密码,具体代码如下:
sheet.ProtectionSettings.SetPassword("cnxy");
sheet.Protected = true;
七、让网格线不可见
默认情况下,Sheet的网格线是可见的,有时候,我们可以设置网格线不可见,具体代码如下:
sheet.ViewOptions.ShowGridLines = false;
八、写入单元格
访问单元格的方式有三种,三种分别如下:
sheet.Cells["A1"]
sheet.Cells[0,0]
sheet.Rows[0].Cells[0]
以上三种方法都可以访问单元格,但如下写入单元格呢,其实方法很简单,如下:
sheet.Cells["A1"].Value= 内容
以上没有加双引号的原因是:内容不一定是字符串,有可能是数字、日期等。
九、单元格样式设置
单元格设置需要使用CellStyle对象,其代码如下:
CellStyle style = new CellStyle();
//设置水平对齐模式
style.HorizontalAlignment = HorizontalAlignmentStyle.Center;
//设置垂直对齐模式
style.VerticalAlignment = VerticalAlignmentStyle.Center;
//设置字体
style.Font.Size = 22 * PT; //PT=20
style.Font.Weight = ExcelFont.BoldWeight;
style.Font.Color = Color.Blue;
sheet.Cells["A1"].Style = style;
填充方式如下:
sheet.Cells[24,1].Style.FillPattern.PatternStyle = FillPatternStyle.Solid;
sheet.Rows[24].Cells[1].Style.FillPattern.PatternForegroundColor = Color.Gainsboro;
设置边框如下:
style.Borders.SetBorders(MultipleBorders.Outside, Color.Black, LineStyle.Thin);
十、合并单元格
合并单元格需使用CellRange对象,我们可以从sheet.Cells.GetSubrange或GetSubrangeAbsolute获得,代码如下:
CellRange range = sheet.Cells.GetSubrange("B2", "J3");
range.Value = "Chart";
range.Merged = true;
sheet.Cells.GetSubrangeAbsolute(24, 1, 24, 9).Merged = true;
十一、创建Chart图表对象
使用的是LineChart对象,代码如下:
LineChart chart =(LineChart)sheet.Charts.Add(ChartType.Line,"B4","J22");
以上意思是从B4到J22创建一个LineChart对象。
设置图表标题不可见,代码如下:
chart.Title.IsVisible = false;
设置X轴与Y轴的标题可见,代码如下:
chart.Axes.Horizontal.Title.Text = "Time";
chart.Axes.Vertical.Title.Text = "Voltage";
十二、给Y轴设置属性
主要使用了chart.Axes.VerticalValue返回的ValueAxis对象,代码如下:
ValueAxis axisY = chart.Axes.VerticalValue;
//Y轴最大刻度与最小刻度
axisY.Minimum = -100;
axisY.Maximum = 100;
//Y轴主要与次要单位大小
axisY.MajorUnit = 20;
axisY.MinorUnit = 10;
//Y轴主要与次要网格是否可见
axisY.MajorGridlines.IsVisible = true;
axisY.MinorGridlines.IsVisible = true;
//Y轴刻度线类型
axisY.MajorTickMarkType = TickMarkType.Cross;
axisY.MinorTickMarkType = TickMarkType.Inside;
十三、附上完整的源代码
using GemBox.Spreadsheet;
using GemBox.Spreadsheet.Charts;
using System;
using System.Collections.Generic;
using System.Diagnostics;
using System.Drawing;
namespace SpreadSheetChartDemo
{
 class Program
 {
 const int PT = 20;
 const int LENGTH = 200;
 const string TIMESNEWROMAN = "Times New Roman";
 const string TITLE = "Spread Sheet Chart Demo";
 static void Main(string[] args)
 {
 SpreadsheetInfo.SetLicense("FREE-LIMITED-KEY");
 ExcelFile excel = new ExcelFile();
 //Excel默认字体
 excel.DefaultFontName = TIMESNEWROMAN;
 //Excel文档属性设置
 excel.DocumentProperties.BuiltIn.Add(new KeyValuePair<BuiltInDocumentProperties, string>(BuiltInDocumentProperties.Title, TITLE));
 excel.DocumentProperties.BuiltIn.Add(new KeyValuePair<BuiltInDocumentProperties, string>(BuiltInDocumentProperties.Author, "CNXY"));
 excel.DocumentProperties.BuiltIn.Add(new KeyValuePair<BuiltInDocumentProperties, string>(BuiltInDocumentProperties.Company, "CNXY"));
 excel.DocumentProperties.BuiltIn.Add(new KeyValuePair<BuiltInDocumentProperties, string>(BuiltInDocumentProperties.Comments, "By CNXY.Website: http://www.cnc6.cn"));
 //新建一个Sheet表格
 ExcelWorksheet sheet = excel.Worksheets.Add(TITLE);
 //设置表格保护
 sheet.ProtectionSettings.SetPassword("cnxy");
 sheet.Protected = true;
 //设置网格线不可见
 sheet.ViewOptions.ShowGridLines = false;
 //定义一个B2-G3的单元格范围
 CellRange range = sheet.Cells.GetSubrange("B2", "J3");
 range.Value = "Chart";
 range.Merged = true;
 //定义一个单元格样式
 CellStyle style = new CellStyle();
 //设置边框
 style.Borders.SetBorders(MultipleBorders.Outside, Color.Black, LineStyle.Thin);
 //设置水平对齐模式
 style.HorizontalAlignment = HorizontalAlignmentStyle.Center;
 //设置垂直对齐模式
 style.VerticalAlignment = VerticalAlignmentStyle.Center;
 //设置字体
 style.Font.Size = 22 * PT;
 style.Font.Weight = ExcelFont.BoldWeight;
 style.Font.Color = Color.Blue;
 range.Style = style;
 //增加Chart
 LineChart chart = (LineChart)sheet.Charts.Add(ChartType.Line,"B4","J22");
 chart.Title.IsVisible = false;
 chart.Axes.Horizontal.Title.Text = "Time";
 chart.Axes.Vertical.Title.Text = "Voltage";
 ValueAxis axisY = chart.Axes.VerticalValue;
 //Y轴最大刻度与最小刻度
 axisY.Minimum = -100;
 axisY.Maximum = 100;
 //Y轴主要与次要单位大小
 axisY.MajorUnit = 20;
 axisY.MinorUnit = 10;
 //Y轴主要与次要网格是否可见
 axisY.MajorGridlines.IsVisible = true;
 axisY.MinorGridlines.IsVisible = true;
 //Y轴刻度线类型
 axisY.MajorTickMarkType = TickMarkType.Cross;
 axisY.MinorTickMarkType = TickMarkType.Inside;
 Random random = new Random();
 double[] data = new double[LENGTH];
 for (int i=0;i< LENGTH; i++)
 {
 if( random.Next(0,100) > 50)
 data[i] = random.NextDouble() * 100;
 else
 data[i] = -random.NextDouble() * 100;
 }
 chart.Series.Add("Random", data);
 //尾部信息
 range = sheet.Cells.GetSubrange("B23", "J24");
 range.Value = $"Write Time:{DateTime.Now:yyyy-MM-dd HH:mm:ss} By CNXY";
 range.Merged = true;
 //B25(三种单元格模式)
 sheet.Cells["B25"].Value = "http://www.cnc6.cn";
 sheet.Cells[24,1].Style.FillPattern.PatternStyle = FillPatternStyle.Solid;
 sheet.Rows[24].Cells[1].Style.FillPattern.PatternForegroundColor = Color.Gainsboro;
 //B25,J25
 sheet.Cells.GetSubrangeAbsolute(24, 1, 24, 9).Merged = true;
 string filePath = $@"{Environment.CurrentDirectory}\SheetChart.xlsx";
 try
 {
 excel.Save(filePath);
 Process.Start(filePath);
 Console.WriteLine("Write successfully");
 }
 catch(Exception ex)
 {
 Console.WriteLine(ex);
 }
 Console.Write("Press any key to continue.");
 Console.ReadKey();
 }
 }
}
十四、生成的Excel
演示的Excel下载地址:
http://xiazai.jb51.net/201712/yuanma/SheetChart.zip

十五、生成的exe
下载地址如下:
http://xiazai.jb51.net/201712/yuanma/SpreadSheetChartDemo.zip
运行结果如下:

以上这篇C#使用Gembox.SpreadSheet向Excel写入数据及图表的实例就是小编分享给大家的全部内容了,希望能给大家一个参考,也希望大家多多支持。

