Echarts是百度推出的免费开源的图表组件,功能丰富,涵盖各行业图表。相信很多同学在网页端都使用过。今天我就来介绍下在React Native中如何使用Echarts来显示各种图表。
首先需要在我们的React Native项目中安装native-echarts组件,该组件是兼容IOS和安卓双平台的。
安装
npm install native-echarts --save
安装完成后在node_modules文件夹下会多出一个文件夹叫native-echarts。
目录结构如下图所示:

基础使用
native-echarts的使用方法基本和网页端的Echarts使用方法一致。组件主要有三个属性:
示例代码:
import React, { Component } from 'react';
import {
 AppRegistry,
 StyleSheet,
 Text,
 View
} from 'react-native';
import Echarts from 'native-echarts';

export default class app extends Component {
 render() {
  const option = {
   title: {
     text: 'ECharts demo'
   },
   tooltip: {},
   legend: {
     data:['销量']
   },
   xAxis: {
     data: ["衬衫","羊毛衫","雪纺衫","裤子","高跟鞋","袜子"]
   },
   yAxis: {},
   series: [{
     name: '销量',
     type: 'bar',
     data: [5, 20, 36, 10, 10, 20]
   }]
  };
  return (
   <Echarts option={option} height={300} />
  );
 }
}

AppRegistry.registerComponent('app', () => app);
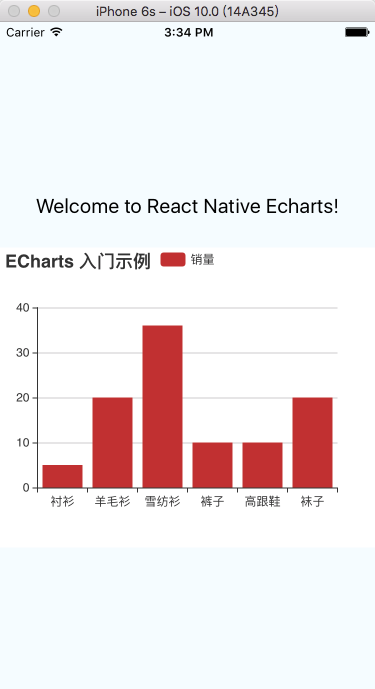
通过上面的代码我们就可以在React Native里面显示一个图表了。但是我们会发现显示的字体会偏小。我们需要适配下移动端的字体,我们需要在native-echarts文件下找到tpl.html文件,在head里面增加下面一句代码:
<meta name="viewport" content="width=device-width, initial-scale=1"> 这样字体大小就显示正常了。
进阶使用:
在使用图表时,如果我们需要使用图表的点击事件,比如点击柱状图的某个柱子,获取到该柱子的信息,再跳转到详情页面,这该怎么做呢?组件本身是没有这个属性的,需要我们自己修改下代码,传递下消息。具体代码如下:
首先我们需要在renderChart.js文件中把需要的数据注入并传递出来(window.postMessage):
import echarts from './echarts.min';
import toString from '../../util/toString';

export default function renderChart(props) {
 const height = props.height || 400;
 const width = props.width || 568;
 return `
  document.getElementById('main').style.height = "${height}px";
  document.getElementById('main').style.width = "${width}px";
  var myChart = echarts.init(document.getElementById('main'));
  myChart.setOption(${toString(props.option)});
  myChart.on('click', function (params) {
   var message = {};
   message.event='click';
   message.seriesName = params.seriesName;
   message.name = params.name;
   window.postMessage(JSON.stringify(message));
 });
 `
}
然后在index.js中做处理(handleMessage):
import React, { Component } from 'react';
import { WebView, View, StyleSheet, Platform } from 'react-native';
import renderChart from './renderChart';
import echarts from './echarts.min';

export default class App extends Component {
 componentWillReceiveProps(nextProps) {
  if(JSON.stringify(nextProps.option) !== JSON.stringify(this.props.option)) {
   this.refs.chart.reload();
  }
 }
 handleMessage = (evt) => {
  const message = JSON.parse(evt.nativeEvent.data)
   this.props.handleMessage(message);
 }
 render() {
  return (
   <View style={{flex: 1, height: this.props.height,width: this.props.width }}>
    <WebView
     ref="chart"
     scrollEnabled = {false}
     injectedJavaScript = {renderChart(this.props)}
     style={{
      height: this.props.height|| 400,
      width: this.props.width || 568,
     }}
     onMessage={this.handleMessage}
     source={require('./tpl.html')}
    />
   </View>
  );
 }
}
最后在使用图表的页面中,修改下代码来接受传递过来的消息:
<Echarts option={option} height={height} width={theme.screenWidth} handleMessage={this.handleMessage} />
在handleMessage方法中就可以写自己的逻辑来处理传递过来数据了。
打包:
如果就这样打包的话,IOS是可以正常打包并显示的。但是在android端打包时会出错。
解决方法:
将index.js中的代码:source={require('./tpl.html')}修改为:
source= {Platform.OS === 'ios' ? require('./tpl.html') : { uri: 'file:///android_asset/tpl.html' }}
同时将tpl.html文件拷贝到安卓项目下面的app/src/main/assets文件夹中。
在执行完react-native bundle命令后,需要手动将资源文件res/drawable-mdpi中生成的tpl.html文件删除,再执行cd android && ./gradlew assembleRelease命令,这样就能成功打包了。
Q1
当数据量比较大的时候,x轴的数据不显示。这个是echarts自己的一个功能,解决办法是设置xAxis-axisLabel-interval为0即可。
Q2
面积折线图中面积颜色“不正“,也就是说和设置的颜色对不上。这个可能是react-native-echarts组件封装的问题,解决办法是设置areaStyle-normal-shadowColor为'#ffffff',同理可以设置lineStyle等。
Q3
打release包的时候报错了,
\android\app\src\main\res\drawable-mdpi\node_modules_nativeecharts_src_components_echarts_tpl.html
Error:Error: The file name must end with .xml or .png
原因:
release打包的时候把node_modules_nativeecharts_src_components_echarts_tpl.html打到了drawable下,这是不行的,要放到assets下。
解决办法是
另外,release版本只能使用uri加载资源,android把tpl.html文件放在android/app/src/main/assets文件里,使用uri:'file:///android_asset/tpl.html'这个地址加载,ios在项目目录下建个文件夹,把tpl文件放里面去,使用uri:'文件名/tpl'加载。

