本文是利用ShapMap实现GIS的简单应用的小例子,以供学习分享使用。关于SharpMap的说明,网上大多是以ShapeFile为例进行简单的说明,就连官网上的例子也不多。本文是自己参考了源代码进行整理的,主要是WinForm的例子。原理方面本文也不过多论述,主要是实例演示,需要的朋友还是以SharpMap源码进行深入研究。
什么是SharpMap ?
SharpMap是一个基于.net 2.0使用C#开发的Map渲染类库,可以渲染各类GIS数据(目前支持ESRI Shape和PostGIS格式),可应用于桌面和Web程序。代码行数近10000行,可以算是一个实现了最基本功能的GIS系统,有利于研究学习使用。
涉及知识点:
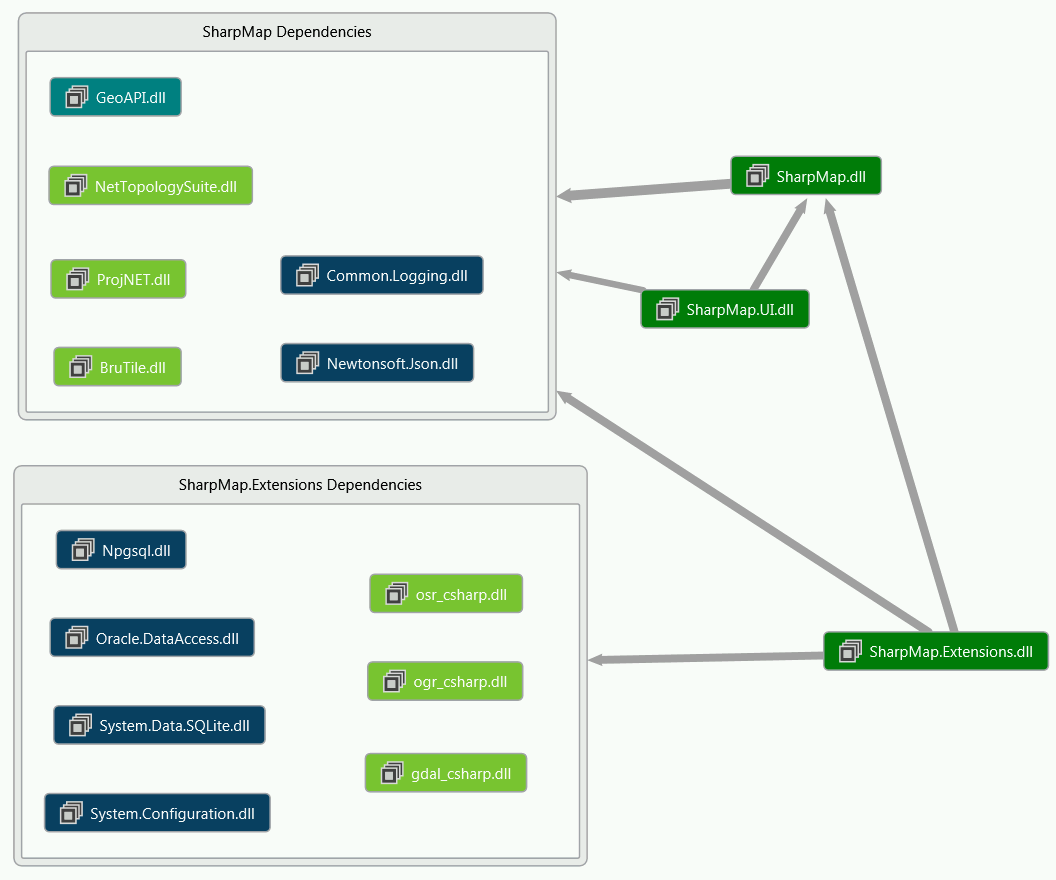
SharpMap知识结构图:
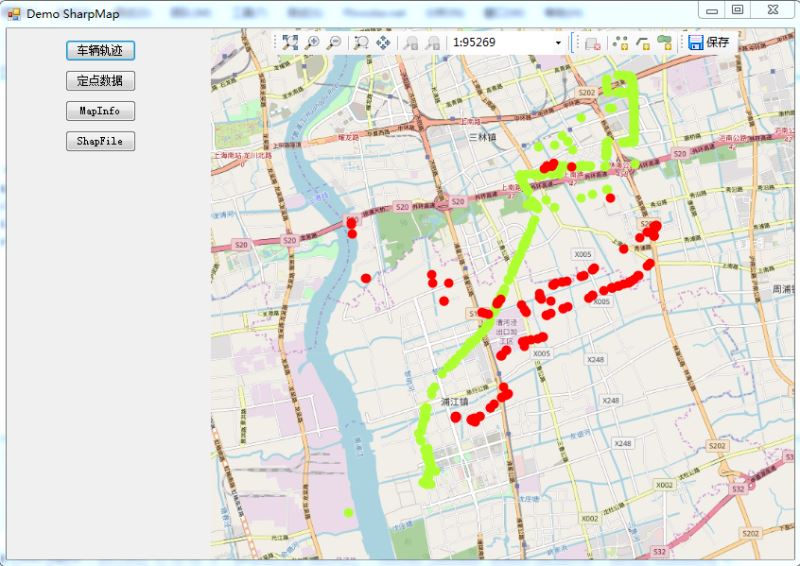
效果图如下:
(一)车辆轨迹图:数据源:Excel数据
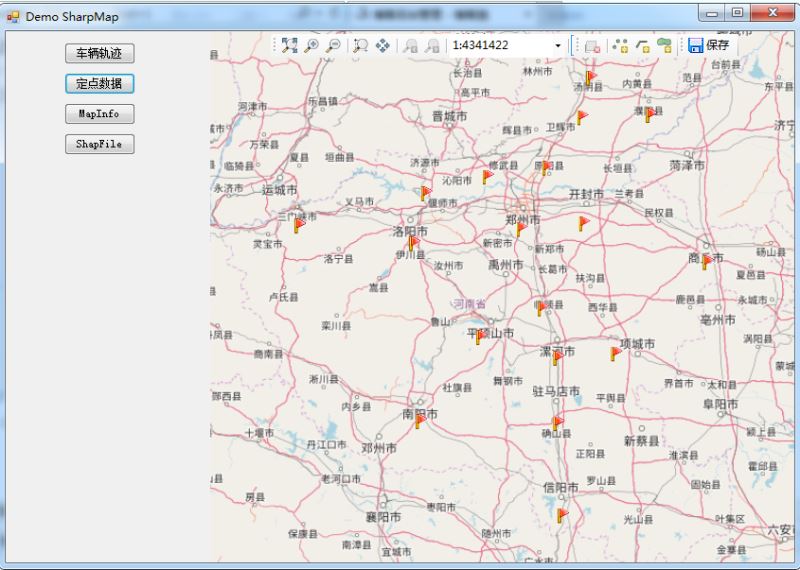
(二)定点数据(数据源:Excel)将河南省十七个城市,全部插上小红旗
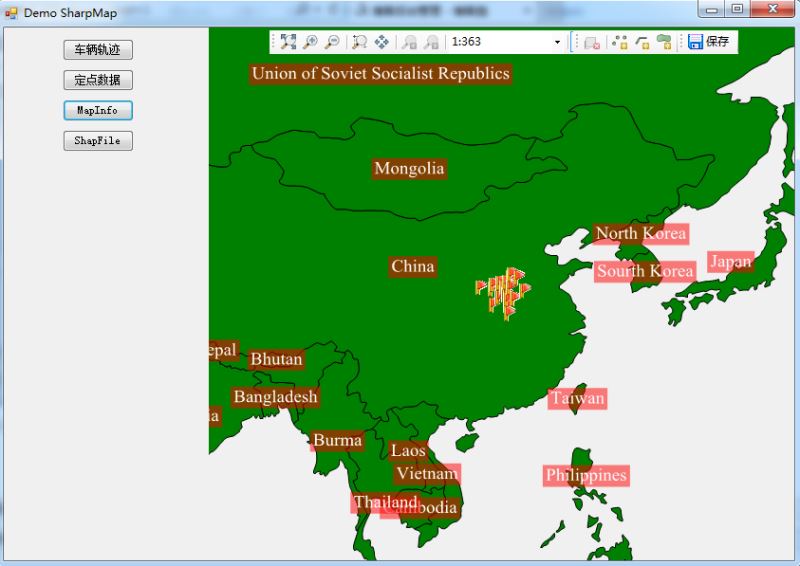
(三)使用MapInfo做背景文件(此处通过程序调整了比例尺)
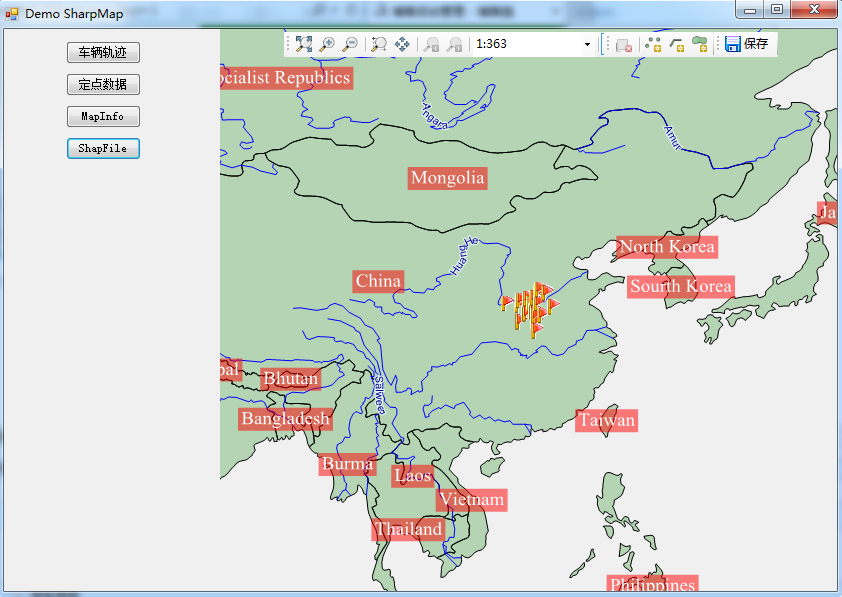
(四)使用ShapFile做背景图
核心代码
using BruTile.Predefined;
using GeoAPI.CoordinateSystems.Transformations;
using ProjNet.CoordinateSystems;
using ProjNet.CoordinateSystems.Transformations;
using SharpMap;
using SharpMap.Data.Providers;
using SharpMap.Layers;
using SharpMap.Rendering;
using SharpMap.Rendering.Thematics;
using SharpMap.Styles;
using System;
using System.Collections.Generic;
using System.Data;
using System.Data.OleDb;
using System.Drawing;
using System.Drawing.Drawing2D;
using System.Drawing.Text;
using System.Linq;
using System.Text;
using Point = GeoAPI.Geometries.Coordinate;
namespace DemoSharpMap
{
 public class SharpMapHelper
 {
 private const string XlsConnectionString = "Provider={2};Data Source={0}\\{1};Extended Properties=\"Excel 8.0;HDR=Yes;IMEX=1\"";
 public static Map InitializeMap(MapType tt,float angle)
 {
  Map map = null;
  switch (tt)
  {
  case MapType.RunLine:
   map = InitializeMapOsmWithXls(angle);
   break;
  case MapType.MapInfo:
   map = InitializeMapinfo(angle);
   break;
  case MapType.ShapeFile:
   map = InitializeMapOrig(angle);
   break;
  case MapType.Static:
   map = InitializeMapOsmWithXls2(angle);
   break;
  default:
   map = InitializeMapOsmWithXls(angle);
   break;
  }
  return map;
 }
 /// <summary>
 /// MapInfo格式的地图文件
 /// </summary>
 /// <param name="angle"></param>
 /// <returns></returns>
 private static Map InitializeMapinfo(float angle)
 {
  //Initialize a new map of size 'imagesize'
  Map map = new Map();
  //Set up the countries layer
  VectorLayer layCountries = new VectorLayer("Countries");
  //Set the datasource to a shapefile in the App_data folder
  try
  {
  layCountries.DataSource = new Ogr("GeoData/MapInfo/countriesMapInfo.tab");
  }
  catch (TypeInitializationException ex)
  {
  if (ex.Message == "The type initializer for 'OSGeo.OGR.Ogr' threw an exception.")
  {
   throw new Exception(
   String.Format(
    "The application threw a PINVOKE exception. You probably need to copy the unmanaged dll's to your bin directory. They are a part of fwtools {0}. You can download it from: http://home.gdal.org/fwtools/",
    GdalRasterLayer.FWToolsVersion));
  }
  throw;
  }
  //Set fill-style to green
  layCountries.Style.Fill = new SolidBrush(Color.Green);
  //Set the polygons to have a black outline
  layCountries.Style.Outline = Pens.Black;
  layCountries.Style.EnableOutline = true;
  layCountries.SRID = 4326;
  //Set up a river layer
  VectorLayer layRivers = new VectorLayer("Rivers");
  //Set the datasource to a shapefile in the App_data folder
  layRivers.DataSource = new Ogr("GeoData/MapInfo/riversMapInfo.tab");
  //Define a blue 1px wide pen
  layRivers.Style.Line = new Pen(Color.Blue, 1);
  layRivers.SRID = 4326;
  //Set up a river layer
  VectorLayer layCities = new VectorLayer("Cities");
  //Set the datasource to a shapefile in the App_data folder
  layCities.DataSource = new Ogr("GeoData/MapInfo/citiesMapInfo.tab");
  layCities.Style.SymbolScale = 0.8f;
  layCities.MaxVisible = 40;
  layCities.SRID = 4326;
  //Set up a country label layer
  LabelLayer layLabel = new LabelLayer("Country labels");
  layLabel.DataSource = layCountries.DataSource;
  layLabel.Enabled = true;
  layLabel.LabelColumn = "Name";
  layLabel.Style = new LabelStyle();
  layLabel.Style.ForeColor = Color.White;
  layLabel.Style.Font = new Font(FontFamily.GenericSerif, 12);
  layLabel.Style.BackColor = new SolidBrush(Color.FromArgb(128, 255, 0, 0));
  layLabel.MaxVisible = 90;
  layLabel.MinVisible = 30;
  layLabel.Style.HorizontalAlignment = LabelStyle.HorizontalAlignmentEnum.Center;
  layLabel.SRID = 4326;
  layLabel.MultipartGeometryBehaviour = LabelLayer.MultipartGeometryBehaviourEnum.Largest;
  //Set up a city label layer
  LabelLayer layCityLabel = new LabelLayer("City labels");
  layCityLabel.DataSource = layCities.DataSource;
  layCityLabel.Enabled = true;
  layCityLabel.LabelColumn = "Name";
  layCityLabel.Style = new LabelStyle();
  layCityLabel.Style.ForeColor = Color.Black;
  layCityLabel.Style.Font = new Font(FontFamily.GenericSerif, 11);
  layCityLabel.MaxVisible = layLabel.MinVisible;
  layCityLabel.Style.HorizontalAlignment = LabelStyle.HorizontalAlignmentEnum.Left;
  layCityLabel.Style.VerticalAlignment = LabelStyle.VerticalAlignmentEnum.Bottom;
  layCityLabel.Style.Offset = new PointF(3, 3);
  layCityLabel.Style.Halo = new Pen(Color.Yellow, 2);
  layCityLabel.TextRenderingHint = TextRenderingHint.AntiAlias;
  layCityLabel.SmoothingMode = SmoothingMode.AntiAlias;
  layCityLabel.SRID = 4326;
  layCityLabel.LabelFilter = LabelCollisionDetection.ThoroughCollisionDetection;
  layCityLabel.Style.CollisionDetection = true;
  //Add the layers to the map object.
  //The order we add them in are the order they are drawn, so we add the rivers last to put them on top
  map.Layers.Add(layCountries);
  map.Layers.Add(layRivers);
  map.Layers.Add(layCities);
  map.Layers.Add(layLabel);
  map.Layers.Add(layCityLabel);
  //增加Layers
  var xlsPath = string.Format(XlsConnectionString, System.IO.Directory.GetCurrentDirectory(), "GeoData\\Henan.xls", Properties.Settings.Default.OleDbProvider);
  var ds = GetDataFromExcel(xlsPath, "Cities");
  //var ct = GetCoordinateTransformation();
  //TransCoordinate(ds, ct);
  string columeName = "Rotation";
  //Add Rotation Column
  AddColumeToDataSet(ds, columeName, -angle);
  var xlsLayer = GetLayerFromDataSet2(ds, Color.GreenYellow);//Set up provider
  map.Layers.Add(xlsLayer); //Add layer to map
  map.Center = xlsLayer.Envelope.Centre;// new Point(0, 0);
  map.MapScale = 350;
  //map.Center = new Point(0, 0);
  //_ogrSampleDataset = "MapInfo";
  //Matrix mat = new Matrix();
  //mat.RotateAt(angle, map.WorldToImage(map.Center));
  //map.MapTransform = mat;
  //map.ZoomToBox(xlsLayer.Envelope);
  return map;
 }
 /// <summary>
 /// ShapeFile
 /// </summary>
 /// <param name="angle"></param>
 /// <returns></returns>
 private static Map InitializeMapOrig(float angle)
 {
  //Initialize a new map of size 'imagesize'
  Map map = new Map();
  //Set up the countries layer
  VectorLayer layCountries = new VectorLayer("Countries");
  //Set the datasource to a shapefile in the App_data folder
  layCountries.DataSource = new ShapeFile("GeoData/World/countries.shp", true);
  //Set fill-style to green
  layCountries.Style.Fill = new SolidBrush(Color.FromArgb(64, Color.Green));
  //Set the polygons to have a black outline
  layCountries.Style.Outline = Pens.Black;
  layCountries.Style.EnableOutline = true;
  layCountries.SRID = 4326;
  //Set up a river layer
  VectorLayer layRivers = new VectorLayer("Rivers");
  //Set the datasource to a shapefile in the App_data folder
  layRivers.DataSource = new ShapeFile("GeoData/World/rivers.shp", true);
  //Define a blue 1px wide pen
  layRivers.Style.Line = new Pen(Color.Blue, 1);
  layRivers.SRID = 4326;
  //Set up a cities layer
  VectorLayer layCities = new VectorLayer("Cities");
  //Set the datasource to a shapefile in the App_data folder
  layCities.DataSource = new ShapeFile("GeoData/World/cities.shp", true);
  layCities.Style.SymbolScale = 0.8f;
  layCities.MaxVisible = 40;
  layCities.SRID = 4326;
  //Set up a country label layer
  LabelLayer layLabel = new LabelLayer("Country labels");
  layLabel.DataSource = layCountries.DataSource;
  layLabel.Enabled = true;
  layLabel.LabelColumn = "Name";
  layLabel.Style = new LabelStyle();
  layLabel.Style.ForeColor = Color.White;
  layLabel.Style.Font = new Font(FontFamily.GenericSerif, 12);
  layLabel.Style.BackColor = new SolidBrush(Color.FromArgb(128, 255, 0, 0));
  layLabel.MaxVisible = 90;
  layLabel.MinVisible = 30;
  layLabel.Style.HorizontalAlignment = LabelStyle.HorizontalAlignmentEnum.Center;
  layLabel.SRID = 4326;
  layLabel.MultipartGeometryBehaviour = LabelLayer.MultipartGeometryBehaviourEnum.Largest;
  layLabel.LabelFilter = LabelCollisionDetection.ThoroughCollisionDetection;
  layLabel.Style.CollisionDetection = true;
  layLabel.LabelPositionDelegate = fdr => fdr.Geometry.InteriorPoint.Coordinate;
  layLabel.PriorityColumn = "POPDENS";
  //Set up a city label layer
  LabelLayer layCityLabel = new LabelLayer("City labels");
  layCityLabel.DataSource = layCities.DataSource;
  layCityLabel.Enabled = true;
  layCityLabel.LabelColumn = "Name";
  layCityLabel.Style = new LabelStyle();
  layCityLabel.Style.ForeColor = Color.Black;
  layCityLabel.Style.Font = new Font(FontFamily.GenericSerif, 11);
  layCityLabel.MaxVisible = layLabel.MinVisible;
  layCityLabel.Style.HorizontalAlignment = LabelStyle.HorizontalAlignmentEnum.Left;
  layCityLabel.Style.VerticalAlignment = LabelStyle.VerticalAlignmentEnum.Bottom;
  layCityLabel.Style.Offset = new PointF(3, 3);
  layCityLabel.Style.Halo = new Pen(Color.Yellow, 2);
  layCityLabel.TextRenderingHint = TextRenderingHint.AntiAlias;
  layCityLabel.SmoothingMode = SmoothingMode.AntiAlias;
  layCityLabel.SRID = 4326;
  layCityLabel.LabelFilter = LabelCollisionDetection.ThoroughCollisionDetection;
  layCityLabel.Style.CollisionDetection = true;
  layCityLabel.PriorityColumn = "POPULATION";
  layCityLabel.Theme = new GradientTheme(layCityLabel.PriorityColumn, 250000, 5000000,
  new LabelStyle
  {
   MaxVisible = 10,
   CollisionBuffer = new Size(0, 0),
   CollisionDetection = true,
   Enabled = true,
   ForeColor = Color.LightSlateGray,
   Halo = new Pen(Color.Silver, 1),
   HorizontalAlignment = LabelStyle.HorizontalAlignmentEnum.Center,
   VerticalAlignment = LabelStyle.VerticalAlignmentEnum.Middle,
   Font = new Font(GenericFontFamilies.SansSerif.ToString(), 8f, FontStyle.Regular)
  },
  new LabelStyle
  {
   MaxVisible = layLabel.MinVisible,
   CollisionBuffer = new Size(3, 3),
   CollisionDetection = true,
   Enabled = true,
   ForeColor = Color.LightSlateGray,
   Halo = new Pen(Color.Silver, 5),
   HorizontalAlignment = LabelStyle.HorizontalAlignmentEnum.Center,
   VerticalAlignment = LabelStyle.VerticalAlignmentEnum.Middle,
   Font = new Font(GenericFontFamilies.SansSerif.ToString(), 16f, FontStyle.Bold)
  });
  bool ignoreLength = false;
  var layRiverLabel = new LabelLayer("River labels")
  {
  DataSource = layRivers.DataSource,
  Enabled = true,
  LabelColumn = "Name",
  TextRenderingHint = TextRenderingHint.AntiAlias,
  SmoothingMode = SmoothingMode.AntiAlias,
  SRID = 4326,
  LabelFilter = LabelCollisionDetection.ThoroughCollisionDetection,
  MultipartGeometryBehaviour = LabelLayer.MultipartGeometryBehaviourEnum.CommonCenter,
  Style =
      new LabelStyle
      {
      ForeColor = Color.DarkBlue,
      Font = new Font(FontFamily.GenericSansSerif, 11),
      HorizontalAlignment = LabelStyle.HorizontalAlignmentEnum.Center,
      VerticalAlignment = LabelStyle.VerticalAlignmentEnum.Middle,
      //CollisionDetection = true,
      Halo = new Pen(Color.Azure, 2),
      IgnoreLength = ignoreLength,
      Offset = new PointF(0, -10)
      },
  };
  //Add the layers to the map object.
  //The order we add them in are the order they are drawn, so we add the rivers last to put them on top
  //map.BackgroundLayer.Add(AsyncLayerProxyLayer.Create(layCountries));
  map.Layers.Add(layCountries);
  map.Layers.Add(layRivers);
  map.Layers.Add(layCities);
  map.Layers.Add(layLabel);
  map.Layers.Add(layCityLabel);
  map.Layers.Add(layRiverLabel);
  //增加Layers
  var xlsPath = string.Format(XlsConnectionString, System.IO.Directory.GetCurrentDirectory(), "GeoData\\Henan.xls", Properties.Settings.Default.OleDbProvider);
  var ds = GetDataFromExcel(xlsPath, "Cities");
  //var ct = GetCoordinateTransformation();
  //TransCoordinate(ds, ct);
  string columeName = "Rotation";
  //Add Rotation Column
  AddColumeToDataSet(ds, columeName, -angle);
  var xlsLayer = GetLayerFromDataSet2(ds, Color.GreenYellow);//Set up provider
  map.Layers.Add(xlsLayer); //Add layer to map
     //limit the zoom to 360 degrees width
     //map.MaximumZoom = 360;
     //map.BackColor = Color.LightBlue;
  //map.Zoom = 360;
  map.Center = xlsLayer.Envelope.Centre;// new Point(0, 0);
  map.MapScale = 350;
  //Matrix mat = new Matrix();
  //mat.RotateAt(angle, map.WorldToImage(map.Center));
  //map.MapTransform = mat;
  //map.ZoomToBox(xlsLayer.Envelope);
  return map;
 }
 /// <summary>
 /// 在线显示,圆点显示轨迹
 /// </summary>
 /// <param name="angle"></param>
 /// <returns></returns>
 private static Map InitializeMapOsmWithXls(float angle)
 {
  var map = new Map();
  var tileLayer = new TileAsyncLayer(
  KnownTileSources.Create(KnownTileSource.OpenStreetMap), "TileLayer - OSM with XLS");
  tileLayer.SRID = 4326;
  map.BackgroundLayer.Add(tileLayer);
  //Get data from excel
  var xlsPath = string.Format(XlsConnectionString, System.IO.Directory.GetCurrentDirectory(), "GeoData\\Cities.xls", Properties.Settings.Default.OleDbProvider);
  var ds = GetDataFromExcel(xlsPath, "Cities");
  var ds1 = GetDataFromExcel(xlsPath, "Cities2");
  var ct = GetCoordinateTransformation();
  TransCoordinate(ds, ct);
  TransCoordinate(ds1, ct);
  string columeName = "Rotation";
  //Add Rotation Column
  AddColumeToDataSet(ds, columeName, -angle);
  AddColumeToDataSet(ds1, columeName, -angle);
  var xlsLayer = GetLayerFromDataSet(ds, Color.GreenYellow);//Set up provider
  map.Layers.Add(xlsLayer); //Add layer to map
  var xlsLayer1 = GetLayerFromDataSet(ds1, Color.Red);
  map.Layers.Add(xlsLayer1);
  var xlsLabelLayer = GetLabelLayerByVectorLayer(xlsLayer, "XLSLabel");
  xlsLabelLayer.Theme = new SharpMap.Rendering.Thematics.FontSizeTheme(xlsLabelLayer, map) { FontSizeScale = 1000f };
  map.Layers.Add(xlsLabelLayer);
  map.ZoomToBox(xlsLayer.Envelope.ExpandedBy(xlsLayer1.Envelope));
  return map;
 }
 /// <summary>
 /// 在线显示,图标显示轨迹
 /// </summary>
 /// <param name="angle"></param>
 /// <returns></returns>
 private static Map InitializeMapOsmWithXls2(float angle)
 {
  var map = new Map();
  var tileLayer = new TileAsyncLayer(
  KnownTileSources.Create(KnownTileSource.OpenStreetMap), "TileLayer - OSM with XLS");
  tileLayer.SRID = 4326;
  map.BackgroundLayer.Add(tileLayer);
  //Get data from excel
  var xlsPath = string.Format(XlsConnectionString, System.IO.Directory.GetCurrentDirectory(), "GeoData\\Henan.xls", Properties.Settings.Default.OleDbProvider);
  var ds = GetDataFromExcel(xlsPath, "Cities");
  var ct = GetCoordinateTransformation();
  TransCoordinate(ds, ct);
  string columeName = "Rotation";
  //Add Rotation Column
  AddColumeToDataSet(ds, columeName, -angle);
  var xlsLayer = GetLayerFromDataSet2(ds, Color.GreenYellow);//Set up provider
  map.Layers.Add(xlsLayer); //Add layer to map
  var xlsLabelLayer = GetLabelLayerByVectorLayer(xlsLayer, "XLSLabel");
  xlsLabelLayer.Theme = new FontSizeTheme(xlsLabelLayer, map) { FontSizeScale = 1000f };
  map.Layers.Add(xlsLabelLayer);
  map.ZoomToBox(xlsLayer.Envelope);
  return map;
 }
 /// <summary>
 /// 从Excel中读取数据
 /// </summary>
 private static DataSet GetDataFromExcel(string xlsPath, string sheetName)
 {
  DataSet ds = new DataSet("XLS");
  string sql = string.Format("SELECT * FROM [{0}$];", sheetName);
  using (var cn = new OleDbConnection(xlsPath))
  {
  cn.Open();
  using (var da = new OleDbDataAdapter(new OleDbCommand(sql, cn)))
  {
   da.Fill(ds);
  }
  }
  return ds;
 }
 /// <summary>
 /// 获取坐标转换对象
 /// </summary>
 /// <returns></returns>
 private static ICoordinateTransformation GetCoordinateTransformation()
 {
  //The SRS for this datasource is EPSG:4326, therefore we need to transfrom it to OSM projection
  var ctf = new CoordinateTransformationFactory();
  var cf = new CoordinateSystemFactory();
  var epsg4326 = cf.CreateFromWkt("GEOGCS[\"WGS 84\",DATUM[\"WGS_1984\",SPHEROID[\"WGS 84\",6378137,298.257223563,AUTHORITY[\"EPSG\",\"7030\"]],AUTHORITY[\"EPSG\",\"6326\"]],PRIMEM[\"Greenwich\",0,AUTHORITY[\"EPSG\",\"8901\"]],UNIT[\"degree\",0.01745329251994328,AUTHORITY[\"EPSG\",\"9122\"]],AUTHORITY[\"EPSG\",\"4326\"]]");
  var epsg3857 = cf.CreateFromWkt("PROJCS[\"Popular Visualisation CRS / Mercator\", GEOGCS[\"Popular Visualisation CRS\", DATUM[\"Popular Visualisation Datum\", SPHEROID[\"Popular Visualisation Sphere\", 6378137, 0, AUTHORITY[\"EPSG\",\"7059\"]], TOWGS84[0, 0, 0, 0, 0, 0, 0], AUTHORITY[\"EPSG\",\"6055\"]],PRIMEM[\"Greenwich\", 0, AUTHORITY[\"EPSG\", \"8901\"]], UNIT[\"degree\", 0.0174532925199433, AUTHORITY[\"EPSG\", \"9102\"]], AXIS[\"E\", EAST], AXIS[\"N\", NORTH], AUTHORITY[\"EPSG\",\"4055\"]], PROJECTION[\"Mercator\"], PARAMETER[\"False_Easting\", 0], PARAMETER[\"False_Northing\", 0], PARAMETER[\"Central_Meridian\", 0], PARAMETER[\"Latitude_of_origin\", 0], UNIT[\"metre\", 1, AUTHORITY[\"EPSG\", \"9001\"]], AXIS[\"East\", EAST], AXIS[\"North\", NORTH], AUTHORITY[\"EPSG\",\"3857\"]]");
  var ct = ctf.CreateFromCoordinateSystems(epsg4326, epsg3857);
  return ct;
 }
 /// <summary>
 /// 转换地球经纬度到坐标
 /// </summary>
 /// <param name="ds"></param>
 /// <param name="ct"></param>
 private static void TransCoordinate(DataSet ds, ICoordinateTransformation ct)
 {
  foreach (System.Data.DataRow row in ds.Tables[0].Rows)
  {
  if (row["X"] == DBNull.Value || row["Y"] == DBNull.Value) continue;
  var coords = new[] { Convert.ToDouble(row["X"]), Convert.ToDouble(row["Y"]) };
  coords = ct.MathTransform.Transform(coords);
  row["X"] = coords[0];
  row["Y"] = coords[1];
  }
 }
 /// <summary>
 /// 增加列
 /// </summary>
 /// <param name="ds"></param>
 /// <param name="columeName"></param>
 /// <param name="columeValue"></param>
 private static void AddColumeToDataSet(DataSet ds, string columeName, float columeValue)
 {
  ds.Tables[0].Columns.Add(columeName, typeof(float));
  foreach (System.Data.DataRow row in ds.Tables[0].Rows)
  {
  row["Rotation"] = -columeValue;
  }
 }
 /// <summary>
 /// 轨迹用点表示
 /// </summary>
 /// <param name="ds"></param>
 /// <param name="c"></param>
 /// <returns></returns>
 private static VectorLayer GetLayerFromDataSet(DataSet ds, Color c)
 {
  var xlsProvider = new DataTablePoint(ds.Tables[0], "OID", "X", "Y");
  var xlsLayer = new VectorLayer("XLS", xlsProvider)
  { Style = new VectorStyle() { PointColor = new SolidBrush(c) } };
  return xlsLayer;
 }
 /// <summary>
 /// 获取带图标的图层
 /// </summary>
 /// <param name="ds"></param>
 /// <param name="c"></param>
 /// <returns></returns>
 private static VectorLayer GetLayerFromDataSet2(DataSet ds, Color c)
 {
  var xlsProvider = new DataTablePoint(ds.Tables[0], "OID", "X", "Y");
  var xlsLayer = new VectorLayer("XLS", xlsProvider)
  { Style = { Symbol=Properties.Resources.redflag} };
  return xlsLayer;
 }
 private static LabelLayer GetLabelLayerByVectorLayer(VectorLayer xlsLayer, string layerName)
 {
  var xlsLabelLayer = new LabelLayer(layerName)
  {
  DataSource = xlsLayer.DataSource,
  LabelColumn = "NAME",
  //PriorityColumn = "Population",
  Style =
   {
   CollisionBuffer = new System.Drawing.SizeF(2f, 2f),
   CollisionDetection = true
   },
  LabelFilter = LabelCollisionDetection.ThoroughCollisionDetection
  };
  return xlsLabelLayer;
 }
 }
 public enum MapType {
 ShapeFile = 0,
 MapInfo = 1,
 RunLine = 2,//运行轨迹
 Static = 3 //定点数据
 }
}
备注:
1. 因用的MapInfo和Shape源文件为源码里面的,所有为英文显示。
源码下载:http://xiazai.jb51.net/201707/yuanma/DemoSharpMap_jb51.rar
总结
以上所述是小编给大家介绍的C# 中SharpMap的简单使用实例详解,希望对大家有所帮助,如果大家有任何疑问请给我留言,小编会及时回复大家的。在此也非常感谢大家对网站的支持!

