其实就是通过 FontProperties来设置的,请参考以下代码:
import matplotlib.pyplot as plt
from matplotlib.font_manager import FontProperties
font = FontProperties(fname=r"c:\windows\fonts\msyh.ttc", size=15)
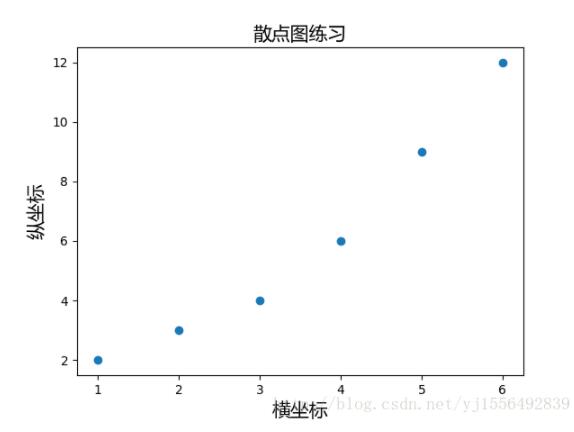
plt.title("散点图练习", fontproperties=font)
plt.scatter([1, 2, 3, 4, 5, 6], [2, 3, 4, 6, 9, 12])
plt.xlabel('横坐标', fontproperties=font)
plt.ylabel('纵坐标', fontproperties=font)
plt.show()
结果如下:
以上这篇在matplotlib的图中设置中文标签的方法就是小编分享给大家的全部内容了,希望能给大家一个参考,也希望大家多多支持。

