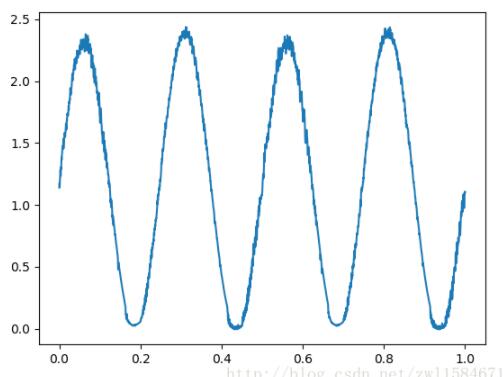
如下所示:
import matplotlib.pyplot as plt
import numpy as np


def readfile(filename):
 dataList = []
 dataNum = 0
 with open(filename,'r') as f:
  for line in f.readlines():
   linestr = line.strip('\n')
   if len(linestr) < 8 and len(linestr) >1:
    dataList.append(float(linestr))
    dataNum += 1
 return dataList, dataNum


y, range = readfile("./session.log")
# print y
print "range=%d" % (range)
x = np.linspace(0, 1, range)
# plt.plot(x, y, 'r-o')
plt.plot(x, y)
plt.show()
数据格式:
0.8960
0.9456
0.9069
0.9128
0.9306
1.0186
1.0327
0.9835
0.9438
0.9807
0.9949
1.0737
1.0842
1.0445
1.0609
1.0664
0.9748
1.0427
1.0983
1.0814
1.1083
1.1051
图形:

以上这篇python实现从文件中读取数据并绘制成 x y 轴图形的方法就是小编分享给大家的全部内容了,希望能给大家一个参考,也希望大家多多支持。