本文实例讲述了JavaScript实现的DOM绘制柱状图效果。分享给大家供大家参考,具体如下:
<!DOCTYPE html>
<html>
<head>
<meta http-equiv="Content-Type" content="text/html; charset=utf-8" />
<title>www.qb5200.com JavaScript DOM绘制柱状图</title>
<style>
#chart-wrap{
width:910px;
height:240px;
border:solid 1px #B3B3DC;
position:relative;
top:40px;
left:20px;
}
</style>
</head>
<body>
<div id="chart-wrap"></div>
<script>
function renderChart(data) {
var cw = document.getElementById("chart-wrap");
cw.innerHTML = "";
var max = 0;
for (var index in data) {
if (data[index] > max)
max = data[index];
}
var percent = 180 / max;
var i = 0;
for (var index in data) {
var bar = document.createElement("div");
bar.id = index + "_" + data[index];
bar.style.height = Math.round(percent * data[index]) + "px";
bar.style.width = "40px";
bar.style.left = (i * 40) + 165 + "px";
bar.style.marginLeft = (i * 20) + "px";
bar.style.position = "absolute";
bar.style.background = "none repeat scroll 0 0 pink";
bar.style.overflow = "hidden";
bar.setAttribute("title", index + ":" + data[index]);
bar.style.display = "block";
bar.style.top = 200 - Math.round(percent * data[index]) + "px";
cw.appendChild(bar);
var axis = document.createElement("div");
axis.id = "axis_" + i;
axis.style.width = "40px";
axis.style.left = (i * 40) + 165 + "px";
axis.style.marginLeft = (i * 20) + "px";
axis.style.textAlign = "center";
axis.style.position = "absolute";
axis.style.top = "205px";
axis.innerHTML = '<span style="font-size:12px; color:grey;"> ' + i + '</span>';
cw.appendChild(axis);
i++;
}
for (var i = 0; i < 5; i++) {
var ayis = document.createElement("div");
ayis.style.width = "30px";
ayis.style.position = "absolute";
ayis.style.top = (36 * i) + (20 - 6) + "px";
ayis.style.left = "140px";
ayis.innerHTML = '<span style="font-size:12px; color:grey;"> ' + Math.round(max - (max / 5) * i) + '</span>';
cw.appendChild(ayis);
var line = document.createElement("div");
line.setAttribute("style", "width:580px; left:165px; border-top:1px dotted grey; height:1px; line-height:1px; display:block; overflow:hidden; position:absolute; ");
line.style.top = (36 * i) + 20 + "px";
cw.appendChild(line);
}
}
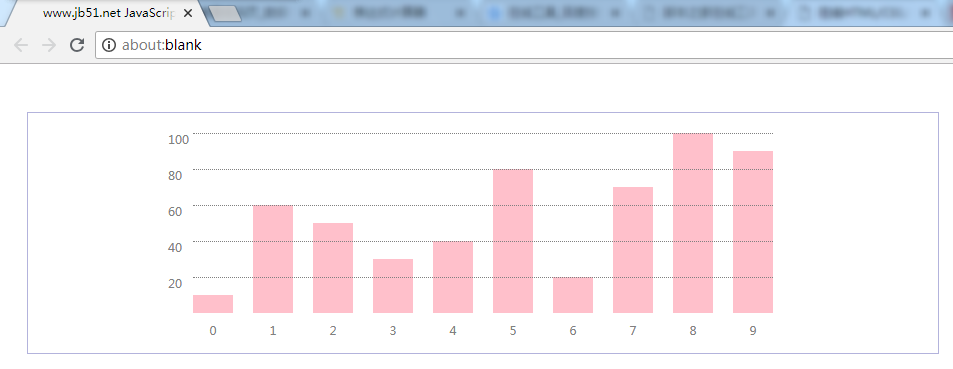
var data = [10,60,50,30,40,80,20,70,100,90];
renderChart(data);
</script>
</body>
</html>
运行效果如下:
希望本文所述对大家JavaScript程序设计有所帮助。

