# encoding=utf-8
import matplotlib.pyplot as plt
from pylab import * #支持中文
mpl.rcParams['font.sans-serif'] = ['SimHei']
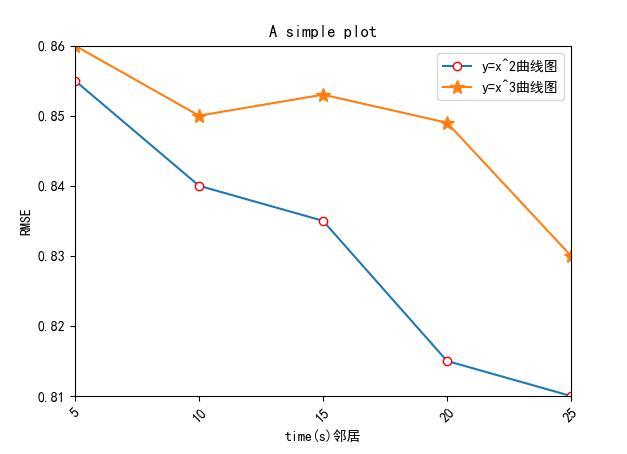
names = ['5', '10', '15', '20', '25']
x = range(len(names))
y = [0.855, 0.84, 0.835, 0.815, 0.81]
y1=[0.86,0.85,0.853,0.849,0.83]
#plt.plot(x, y, 'ro-')
#plt.plot(x, y1, 'bo-')
#pl.xlim(-1, 11) # 限定横轴的范围
#pl.ylim(-1, 110) # 限定纵轴的范围
plt.plot(x, y, marker='o', mec='r', mfc='w',label=u'y=x^2曲线图')
plt.plot(x, y1, marker='*', ms=10,label=u'y=x^3曲线图')
plt.legend() # 让图例生效
plt.xticks(x, names, rotation=45)
plt.margins(0)
plt.subplots_adjust(bottom=0.15)
plt.xlabel(u"time(s)邻居") #X轴标签
plt.ylabel("RMSE") #Y轴标签
plt.title("A simple plot") #标题
plt.show()
效果图: