打算开发web性能监控,以后会去学js,现在用matp来补救下,在官网有此类模板,花了一点时间修改了下,有兴趣的可以去官网看看。
基于matplotoilb和psutil,matplotoilb是有名的数据数据可视化工具,psutil是性能监控工具,所以你需要这两个环境,本文不多说环境的安装。
以下是代码:
#!/usr/bin/env python
#-*-coding:utf-8 -*-
import matplotlib.pyplot as plt
import matplotlib.animation as animation
import psutil
def data_gen(t=0): #设置xy变量
 x = 0
 y = 1
 while True:
 y = psutil.cpu_percent(interval=1) #获取cpu数值,1s获取一次。
 x += 1
 yield x,y
def init():
 ax.set_xlim(0, 10)   #起始x 1-10
 ax.set_ylim(0, 100)   #设置y相当于0%-100%
 del xdata[:]
 del ydata[:]
 line.set_data(xdata, ydata)
 return line,

fig, ax = plt.subplots()
line, = ax.plot([], [], lw=2)  #线像素比
ax.grid()
xdata, ydata = [], []


def run(data):
 # update the data
 t, y = data
 xdata.append(t)
 ydata.append(y)
 xmin, xmax = ax.get_xlim()

 if t >= xmax:   #表格随数据移动
 ax.set_xlim(xmin+10, xmax+10)
 ax.figure.canvas.draw()
 line.set_data(xdata, ydata)

 return line,

ani = animation.FuncAnimation(fig, run, data_gen, blit=False, interval=10,
repeat=False, init_func=init)
plt.show()
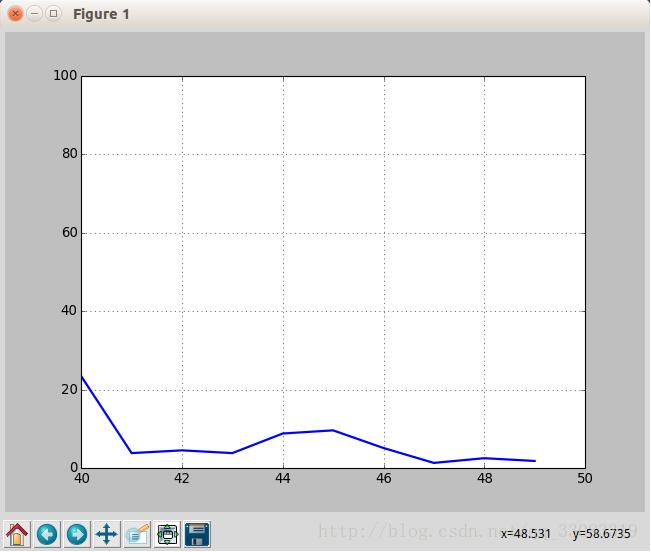
下面是效果图,还有很多地方不完善,以后会花点时间完成。