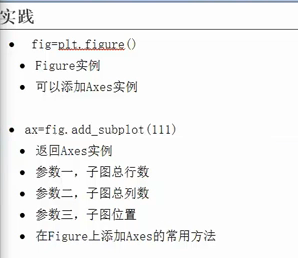
本文实例讲述了Python使用add_subplot与subplot画子图操作。分享给大家供大家参考,具体如下:
子图:就是在一张figure里面生成多张子图。
Matplotlib对象简介
FigureCanvas 画布
Figure 图
Axes 坐标轴(实际画图的地方)
注意,pyplot的方式中plt.subplot()参数和面向对象中的add_subplot()参数和含义都相同。
使用面向对象的方式
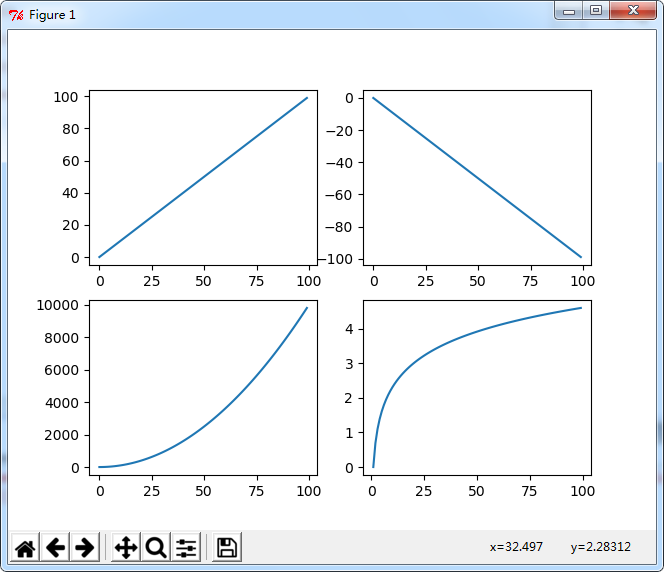
#!/usr/bin/python
#coding: utf-8
import numpy as np
import matplotlib.pyplot as plt
x = np.arange(0, 100)
fig = plt.figure()
ax1 = fig.add_subplot(221)
ax1.plot(x, x)
ax2 = fig.add_subplot(222)
ax2.plot(x, -x)
ax3 = fig.add_subplot(223)
ax3.plot(x, x ** 2)
ax4 = fig.add_subplot(224)
ax4.plot(x, np.log(x))
plt.show()
pyplot的方式
#!/usr/bin/python
#coding: utf-8
import numpy as np
import matplotlib.pyplot as plt
x = np.arange(0, 100)
plt.subplot(221)
plt.plot(x, x)
plt.subplot(222)
plt.plot(x, -x)
plt.subplot(223)
plt.plot(x, x ** 2)
plt.subplot(224)
plt.plot(x, np.log(x))
plt.show()
运行结果:
希望本文所述对大家Python程序设计有所帮助。

