<!DOCTYPE html>
<html lang="en">
<head>
 <meta charset="UTF-8">
 <title>Title</title>
 <style>
 canvas {
 border: 1px solid #ccc;
 }
 </style>
</head>
<body>
<canvas width="600" height="400"></canvas>
<script>
 /*1.构造函数*/
 var LineChart = function (ctx) {
 /*获取绘图工具*/
 this.ctx = ctx || document.querySelector('canvas').getContext('2d');
 /*画布的大小*/
 this.canvasWidth = this.ctx.canvas.width;
 this.canvasHeight = this.ctx.canvas.height;
 /*网格的大小*/
 this.gridSize = 10;
 /*坐标系的间距*/
 this.space = 20;
 /*坐标原点*/
 this.x0 = this.space;
 this.y0 = this.canvasHeight - this.space;
 /*箭头的大小*/
 this.arrowSize = 10;
 /*绘制点*/
 this.dottedSize = 6;
 /*点的坐标 和数据有关系 数据可视化*/
 }
 /*2.行为方法*/
 LineChart.prototype.init = function (data) {
 this.drawGrid();
 this.drawAxis();
 this.drawDotted(data);
 };
 /*绘制网格*/
 LineChart.prototype.drawGrid = function () {
 /*x方向的线*/
 var xLineTotal = Math.floor(this.canvasHeight / this.gridSize);
 this.ctx.strokeStyle = '#eee';
 for (var i = 0; i <= xLineTotal; i++) {
 this.ctx.beginPath();
 this.ctx.moveTo(0, i * this.gridSize - 0.5);
 this.ctx.lineTo(this.canvasWidth, i * this.gridSize - 0.5);
 this.ctx.stroke();
 }
 /*y方向的线*/
 var yLineTotal = Math.floor(this.canvasWidth / this.gridSize);
 for (var i = 0; i <= yLineTotal; i++) {
 this.ctx.beginPath();
 this.ctx.moveTo(i * this.gridSize - 0.5, 0);
 this.ctx.lineTo(i * this.gridSize - 0.5, this.canvasHeight);
 this.ctx.stroke();
 }
 };
 /*绘制坐标系*/
 LineChart.prototype.drawAxis = function () {
 /*X轴*/
 this.ctx.beginPath();
 this.ctx.strokeStyle = '#000';
 this.ctx.moveTo(this.x0, this.y0);
 this.ctx.lineTo(this.canvasWidth - this.space, this.y0);
 this.ctx.lineTo(this.canvasWidth - this.space - this.arrowSize, this.y0 + this.arrowSize / 2);
 this.ctx.lineTo(this.canvasWidth - this.space - this.arrowSize, this.y0 - this.arrowSize / 2);
 this.ctx.lineTo(this.canvasWidth - this.space, this.y0);
 this.ctx.stroke();
 this.ctx.fill();
 /*Y轴*/
 this.ctx.beginPath();
 this.ctx.strokeStyle = '#000';
 this.ctx.moveTo(this.x0, this.y0);
 this.ctx.lineTo(this.space, this.space);
 this.ctx.lineTo(this.space + this.arrowSize / 2, this.space + this.arrowSize);
 this.ctx.lineTo(this.space - this.arrowSize / 2, this.space + this.arrowSize);
 this.ctx.lineTo(this.space, this.space);
 this.ctx.stroke();
 this.ctx.fill();
 };
 /*绘制所有点*/
 LineChart.prototype.drawDotted = function (data) {
 /*1.数据的坐标 需要转换 canvas坐标*/
 /*2.再进行点的绘制*/
 /*3.把线连起来*/
 var that = this;
 /*记录当前坐标*/
 var prevCanvasX = 0;
 var prevCanvasY = 0;
 data.forEach(function (item, i) {
 /* x = 原点的坐标 + 数据的坐标 */
 /* y = 原点的坐标 - 数据的坐标 */
 var canvasX = that.x0 + item.x;
 var canvasY = that.y0 - item.y;
 /*绘制点*/
 that.ctx.beginPath();
 that.ctx.moveTo(canvasX - that.dottedSize / 2, canvasY - that.dottedSize / 2);
 that.ctx.lineTo(canvasX + that.dottedSize / 2, canvasY - that.dottedSize / 2);
 that.ctx.lineTo(canvasX + that.dottedSize / 2, canvasY + that.dottedSize / 2);
 that.ctx.lineTo(canvasX - that.dottedSize / 2, canvasY + that.dottedSize / 2);
 that.ctx.closePath();
 that.ctx.fill();
 /*点的连线*/
 /*当时第一个点的时候 起点是 x0 y0*/
 /*当时不是第一个点的时候 起点是 上一个点*/
 if(i == 0){
 that.ctx.beginPath();
 that.ctx.moveTo(that.x0,that.y0);
 that.ctx.lineTo(canvasX,canvasY);
 that.ctx.stroke();
 }else{
 /*上一个点*/
 that.ctx.beginPath();
 that.ctx.moveTo(prevCanvasX,prevCanvasY);
 that.ctx.lineTo(canvasX,canvasY);
 that.ctx.stroke();
 }
 /*记录当前的坐标,下一次要用*/
 prevCanvasX = canvasX;
 prevCanvasY = canvasY;
 });
 };
 /*3.初始化*/
 var data = [
 {
 x: 100,
 y: 120
 },
 {
 x: 200,
 y: 160
 },
 {
 x: 300,
 y: 240
 },
 {
 x: 400,
 y: 120
 },
 {
 x: 500,
 y: 80
 }
 ];
 var lineChart = new LineChart();
 lineChart.init(data);
</script>
</body>
</html>
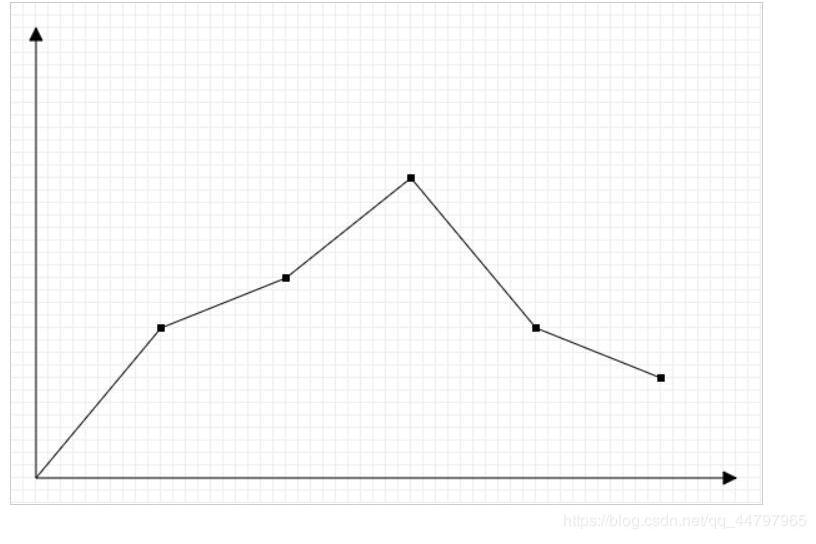
运行结果如下: