
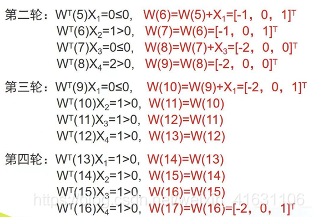
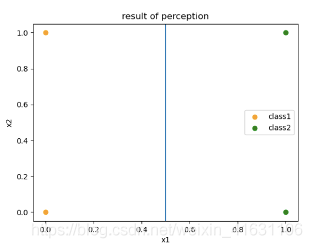
该轮迭代分类结果全部正确,判别函数为g(x)=-2x1+1
(1)由数学求解过程可知:

(2)程序运行结果

(3)绘图结果
'''
20210610 Julyer 感知器
'''
import numpy as np
import matplotlib.pyplot as plt

def get_zgxl(xn, a):
    '''
    获取增广向量
    :param x: 数组
    :param a: 1或-1
    :return:
    '''
    temp = []
    if a == 1:
        xn.append(1)
    if a == -1:
        for i in range(len(xn)):
            temp.append(xn[i]*(-1))
        temp.append(-1)
        xn = temp
    # print('xn:'+ str(np.array(x).reshape(-1, 1)))
    return np.array(xn).reshape(-1, 1)

def calculate_w(w, xn):
    '''
    已知xn和初始值,计算w
    :param w: 列向量 --> wT:行向量
    :param xn: 列向量
    :return:
    '''
    # wT = w.reshape(1, -1)  # 列向量转变为行向量,改变w
    wT = w.T   # 列向量转变为行向量,不改变w
    wTx = np.dot(wT, xn).reshape(-1)  # 行向量乘以列向量, 维度降为1。
    #wTx = wT@xn  # 行向量乘以列向量
    if wTx > 0:
        w_value = w
    else:
        w_value = np.add(w, xn)

    # print("w_update的shape" + str(w_update.shape))
    #print("wTx:" + str(wTx))
    return w_value, wTx     # w_value为列向量, wTx为一个数


def fit_one(w1, x1, x2, x3, x4):
    '''
    完成一轮迭代,遍历一次数据,更新到w5。
    :param w1: 初始值
    :param x1:
    :param x2:
    :param x3:
    :param x4:
    :return: 返回w5和wTx的列表。
    '''
    wTx_list = []
    update_w = w1

    for i in range(0, len(x_data)): #len计算样本个数,通过循环更新w
        update_w, wTx = calculate_w(update_w, x_data[i])
        wTx_list.append(wTx)

    #print(wTx_list)
    return update_w, wTx_list

def draw_plot(class1, class2, update_w):
    plt.figure()

    x_coordinate = []
    y_coordinate = []
    for i in range(len(class1)):
        x_coordinate.append(class1[i][0])
        y_coordinate.append(class1[i][1])
    plt.scatter(x_coordinate, y_coordinate, color='orange', label='class1')

    x_coordinate = []
    y_coordinate = []
    for i in range(len(class2)):
        x_coordinate.append(class2[i][0])
        y_coordinate.append(class2[i][1])
    plt.scatter(x_coordinate, y_coordinate, color='green', label='class2')

    w_reshape = update_w.reshape(-1)
    #print

    x = np.linspace(0, 2, 5)
    if w_reshape[1] == 0:
        plt.axvline(x = (-1) * w_reshape[2]/w_reshape[0])
    else:
        plt.plot(x, (x*w_reshape[0]*(-1) + w_reshape[2]*(-1))/w_reshape[1])

    plt.title('result of perception')
    plt.xlabel('x1')
    plt.ylabel('x2')
    plt.legend()
    plt.show()

if __name__ == '__main__':
    x1 = [0, 0]
    x2 = [0, 1]
    x3 = [1, 0]
    x4 = [1, 1]
    class1 = [x1, x2]
    class2 = [x3, x4]

    x1 = get_zgxl(x1, 1)
    x2 = get_zgxl(x2, 1)
    x3 = get_zgxl(x3, -1)
    x4 = get_zgxl(x4, -1)
    x_data = [x1, x2, x3, x4]
    # print(x_data)

    w1 = np.zeros((3, 1))  # 初始值w1为列向量
    #print('w1:' + str(w1) + '\n')

    update_w = w1
    update_w, wTx_list = fit_one(update_w, x1, x2, x3, x4)

    count = 0
    iter_number = 0

    for wTx in wTx_list:
        if wTx > 0:
            count += 1
        if count < 4:
            update_w, wTx_list = fit_one(update_w, x1, x2, x3, x4)
            iter_number += 1
        else:
            break

    print('迭代次数为:' + str(iter_number))
    print('迭代终止时的w:'+'\n' + str(update_w))
    #print(wTx_list)
    draw_plot(class1, class2, update_w)

