我使用了seaborn,通过sns.set_style可以让绘制出来的图更漂亮,而且可以切换不同的类型
import re
import seaborn as sns
import matplotlib.pyplot as plt
import matplotlib.cm as cm
import shutil
import os
sns.set_style('whitegrid')
我用的数据是通过深度强化得到的回报曲线。数据结构如下所示,我所需要的是从train开始的部分,分别对应总的回报,平均回报和回报的方差。我采用了re.findall的正则表达式去提取我所需要的数据,具体的操作方式可以查看源码。
10-15 22:23:15 DATA/traffic DEBUG train 0 totalreward : -99477.0 ReturnAvg : -102.55360824742269 ReturnStd : 34.34301970480272
10-15 22:23:29 DATA/traffic DEBUG train 1 totalreward : -83131.0 ReturnAvg : -85.70206185567011 ReturnStd : 53.442993000985545
file_path = 'log.txt'
content = []
with open(file_path, 'r') as f:
    for line in f.readlines():
        line = line.strip('\n')
        content.append(line)
iter = []
totalreward = []
returnavg = []
returnstd = []
for line in content:
    str1 = re.findall('train.+', line)
    v = [float(x) for x in re.findall('-?\d+.?\d+|\d+', str1[0])]
    iter.append(v[0])
    totalreward.append(v[1])
    returnavg.append(v[2])
    returnstd.append(v[3])
直接将图像保存到Plot的文件夹,这里保存不了jpg格式,一直保存,最后将其保存为png格式成功。设置分辨率为1000,其实差不多,只是线更清楚了。
color = cm.viridis(0.5)
f, ax = plt.subplots(1,1)
ax.plot(iter, totalreward, color=color)
ax.legend()
ax.set_xlabel('Iteration')
ax.set_ylabel('Return')
exp_dir = 'Plot/'
if not os.path.exists(exp_dir):
    os.makedirs(exp_dir, exist_ok=True)
else:
    os.makedirs(exp_dir, exist_ok=True)
f.savefig(os.path.join('Plot', 'reward' + '.png'), dpi=1000)
曲线如下图,可通过plt.show()显示出来,或者直接在console输入f并回车

在强化学习的论文中,我们经常看到一条收敛线,周围还有浅浅的范围线,那些范围线就是方差。绘制代码如下,主要包含了fill_between.
color = cm.viridis(0.7)
f, ax = plt.subplots(1,1)
ax.plot(iter, returnavg, color=color)
r1 = list(map(lambda x: x[0]-x[1], zip(returnavg, returnstd)))
r2 = list(map(lambda x: x[0]+x[1], zip(returnavg, returnstd)))
ax.fill_between(iter, r1, r2, color=color, alpha=0.2)
ax.legend()
ax.set_xlabel('Iteration')
ax.set_ylabel('Return')
exp_dir = 'Plot/'
if not os.path.exists(exp_dir):
    os.makedirs(exp_dir, exist_ok=True)
f.savefig(os.path.join('Plot', 'avgreward' + '.png'), dpi=50)
结果如下
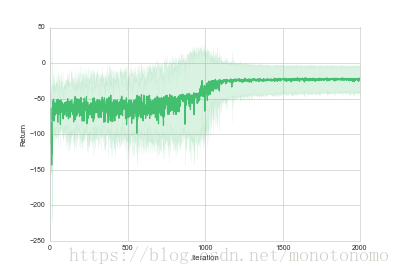
可以看到深绿色上下包裹着浅绿色的线,这就是fill_between的作用,其中可以调节alpha来改变颜色深度。

