#模块使用
【付费VIP完整版】只要看了就能学会的教程,80集Python基础入门视频教学
爬虫代码实现步骤: 发送请求 >>> 获取数据 >>> 解析数据 >>> 保存数据
import requests # 数据请求模块 第三方模块 pip install requests
import parsel # 数据解析模块
import re
import csv
url = 'https://bj.lianjia.com/ershoufang/pg1/'
# 需要携带上 请求头: 把python代码伪装成浏览器 对于服务器发送请求
# User-Agent 浏览器的基本信息
headers = {
    'User-Agent': 'Mozilla/5.0 (Windows NT 10.0; Win64; x64) AppleWebKit/537.36 (KHTML, like Gecko) Chrome/94.0.4606.61 Safari/537.36'
}
response = requests.get(url=url, headers=headers)
print(response.text)
selector_1 = parsel.Selector(response.text)
# 把获取到response.text 数据内容转成 selector 对象
href = selector_1.css('div.leftContent li div.title a::attr(href)').getall()
for link in href:
    html_data = requests.get(url=link, headers=headers).text
    selector = parsel.Selector(html_data)
    # css选择器 语法
    # try:
    title = selector.css('.title h1::text').get() # 标题
    area = selector.css('.areaName .info a:nth-child(1)::text').get()  # 区域
    community_name = selector.css('.communityName .info::text').get()  # 小区
    room = selector.css('.room .mainInfo::text').get()  # 户型
    room_type = selector.css('.type .mainInfo::text').get()  # 朝向
    height = selector.css('.room .subInfo::text').get().split('/')[-1]  # 楼层
    # 中楼层/共5层 split('/') 进行字符串分割  ['中楼层', '共5层'] [-1]
    # ['中楼层', '共5层'][-1] 列表索引位置取值 取列表中最后一个元素  共5层
    # re.findall('共(\d+)层', 共5层) >>>  [5][0] >>> 5
    height = re.findall('共(\d+)层', height)[0]
    sub_info = selector.css('.type .subInfo::text').get().split('/')[-1]  # 装修
    Elevator = selector.css('.content li:nth-child(12)::text').get()  # 电梯
    # if Elevator == '暂无数据电梯' or Elevator == None:
    #     Elevator = '无电梯'
    house_area = selector.css('.content li:nth-child(3)::text').get().replace('㎡', '')  # 面积
    price = selector.css('.price .total::text').get()  # 价格(万元)
    date = selector.css('.area .subInfo::text').get().replace('年建', '')  # 年份
    dit = {
        '标题': title,
        '市区': area,
        '小区': community_name,
        '户型': room,
        '朝向': room_type,
        '楼层': height,
        '装修情况': sub_info,
        '电梯': Elevator,
        '面积(㎡)': house_area,
        '价格(万元)': price,
        '年份': date,
    }
    csv_writer.writerow(dit)
    print(title, area, community_name, room, room_type, height, sub_info, Elevator, house_area, price, date,
          sep='|')
f = open('二手房数据.csv', mode='a', encoding='utf-8', newline='')
csv_writer = csv.DictWriter(f, fieldnames=[
    '标题',
    '市区',
    '小区',
    '户型',
    '朝向',
    '楼层',
    '装修情况',
    '电梯',
    '面积(㎡)',
    '价格(万元)',
    '年份',
])
csv_writer.writeheader()

import pandas as pd
from pyecharts.charts import Map
from pyecharts.charts import Bar
from pyecharts.charts import Line
from pyecharts.charts import Grid
from pyecharts.charts import Pie
from pyecharts.charts import Scatter
from pyecharts import options as opts
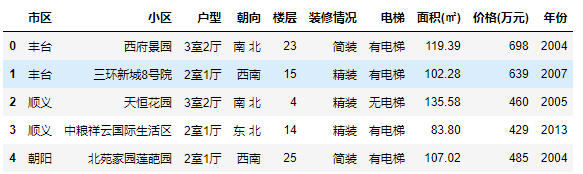
df = pd.read_csv('链家.csv', encoding = 'utf-8')
df.head()
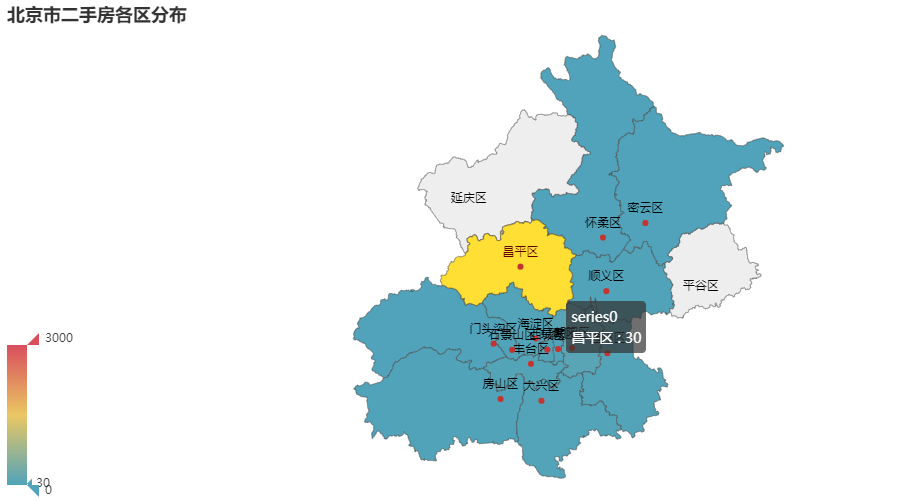
new = [x + '区' for x in region]
m = (
        Map()
        .add('', [list(z) for z in zip(new, count)], '北京')
        .set_global_opts(
            title_opts=opts.TitleOpts(title='北京市二手房各区分布'),
            visualmap_opts=opts.VisualMapOpts(max_=3000),
        )
    )
m.render_notebook()
df_price.values.tolist()
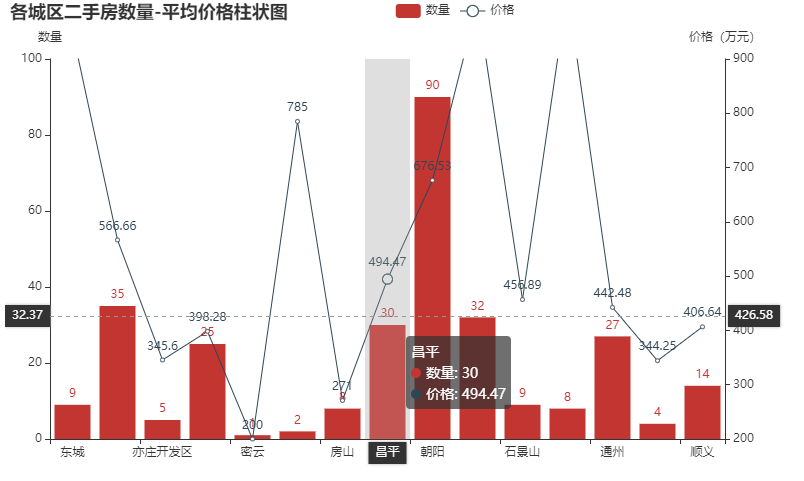
price = [round(x,2) for x in df_price.values.tolist()]
bar = (
Bar()
.add_xaxis(region)
.add_yaxis('数量', count,
label_opts=opts.LabelOpts(is_show=True))
.extend_axis(
yaxis=opts.AxisOpts(
name="价格(万元)",
type_="value",
min_=200,
max_=900,
interval=100,
axislabel_opts=opts.LabelOpts(formatter="{value}"),
)
)
.set_global_opts(
title_opts=opts.TitleOpts(title='各城区二手房数量-平均价格柱状图'),
tooltip_opts=opts.TooltipOpts(
is_show=True, trigger="axis", axis_pointer_type="cross"
),
xaxis_opts=opts.AxisOpts(
type_="category",
axispointer_opts=opts.AxisPointerOpts(is_show=True, type_="shadow"),
),
yaxis_opts=opts.AxisOpts(name='数量',
axistick_opts=opts.AxisTickOpts(is_show=True),
splitline_opts=opts.SplitLineOpts(is_show=False),)
)
)
line2 = (
Line()
.add_xaxis(xaxis_data=region)
.add_yaxis(
series_name="价格",
yaxis_index=1,
y_axis=price,
label_opts=opts.LabelOpts(is_show=True),
z=10
)
)
bar.overlap(line2)
grid = Grid()
grid.add(bar, opts.GridOpts(pos_left="5%", pos_right="20%"), is_control_axis_index=True)
grid.render_notebook()
area0 = top_price['小区'].values.tolist()
count = top_price['价格(万元)'].values.tolist()

bar = (
    Bar()
    .add_xaxis(area0)
    .add_yaxis('数量', count,category_gap = '50%')
    .set_global_opts(
        yaxis_opts=opts.AxisOpts(name='价格(万元)'),
        xaxis_opts=opts.AxisOpts(name='数量'),
    )
)
bar.render_notebook()

s = (
    Scatter()
    .add_xaxis(df['面积(㎡)'].values.tolist())
    .add_yaxis('',df['价格(万元)'].values.tolist())
    .set_global_opts(xaxis_opts=opts.AxisOpts(type_='value'))
)
s.render_notebook()

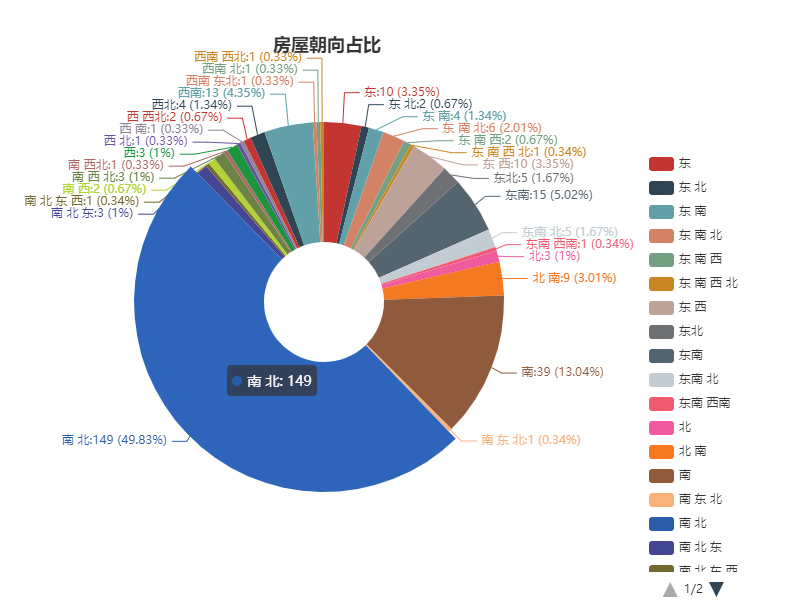
directions = df_direction.index.tolist()
count = df_direction.values.tolist()

c1 = (
    Pie(init_opts=opts.InitOpts(
            width='800px', height='600px',
            )
       )
        .add(
        '',
        [list(z) for z in zip(directions, count)],
        radius=['20%', '60%'],
        center=['40%', '50%'],
#         rosetype="radius",
        label_opts=opts.LabelOpts(is_show=True),
        )
        .set_global_opts(title_opts=opts.TitleOpts(title='房屋朝向占比',pos_left='33%',pos_top="5%"),
                        legend_opts=opts.LegendOpts(type_="scroll", pos_left="80%",pos_top="25%",orient="vertical")
                        )
        .set_series_opts(label_opts=opts.LabelOpts(formatter='{b}:{c} ({d}%)'),position="outside")
    )
c1.render_notebook()
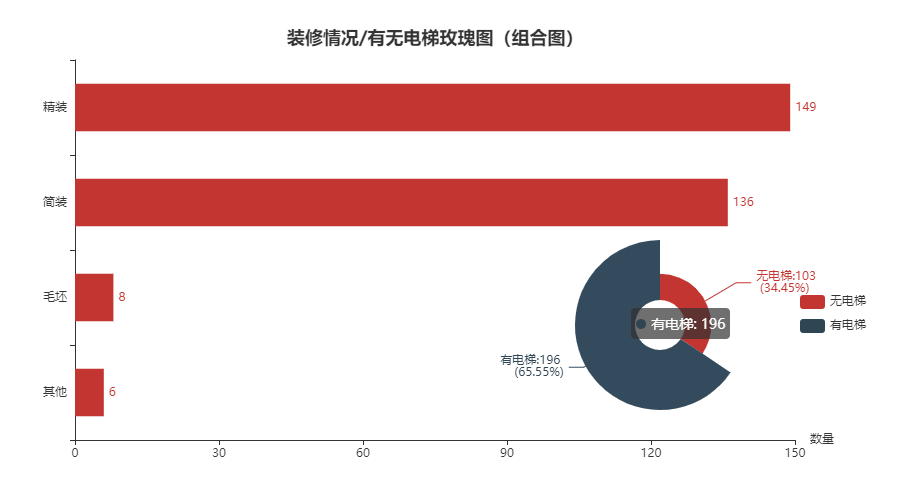
fitment = df_fitment.index.tolist()
count1 = df_fitment.values.tolist()

directions = df_direction.index.tolist()
count2 = df_direction.values.tolist()

bar = (
    Bar()
    .add_xaxis(fitment)
    .add_yaxis('', count1, category_gap = '50%')
    .reversal_axis()
    .set_series_opts(label_opts=opts.LabelOpts(position='right'))
    .set_global_opts(
        xaxis_opts=opts.AxisOpts(name='数量'),
        title_opts=opts.TitleOpts(title='装修情况/有无电梯玫瑰图(组合图)',pos_left='33%',pos_top="5%"),
        legend_opts=opts.LegendOpts(type_="scroll", pos_left="90%",pos_top="58%",orient="vertical")
    )
)

c2 = (
    Pie(init_opts=opts.InitOpts(
            width='800px', height='600px',
            )
       )
        .add(
        '',
        [list(z) for z in zip(directions, count2)],
        radius=['10%', '30%'],
        center=['75%', '65%'],
        rosetype="radius",
        label_opts=opts.LabelOpts(is_show=True),
        )
        .set_global_opts(title_opts=opts.TitleOpts(title='有/无电梯',pos_left='33%',pos_top="5%"),
                        legend_opts=opts.LegendOpts(type_="scroll", pos_left="90%",pos_top="15%",orient="vertical")
                        )
        .set_series_opts(label_opts=opts.LabelOpts(formatter='{b}:{c} \n ({d}%)'),position="outside")
    )

bar.overlap(c2)
bar.render_notebook()
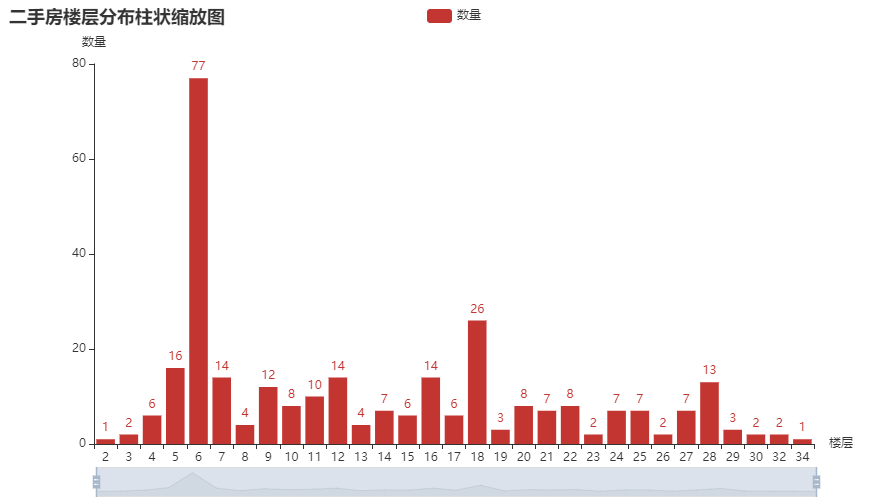
floor = df_floor.index.tolist()
count = df_floor.values.tolist()
bar = (
    Bar()
    .add_xaxis(floor)
    .add_yaxis('数量', count)
    .set_global_opts(
        title_opts=opts.TitleOpts(title='二手房楼层分布柱状缩放图'),
        yaxis_opts=opts.AxisOpts(name='数量'),
        xaxis_opts=opts.AxisOpts(name='楼层'),
        datazoom_opts=opts.DataZoomOpts(type_='slider')
    )
)
bar.render_notebook()
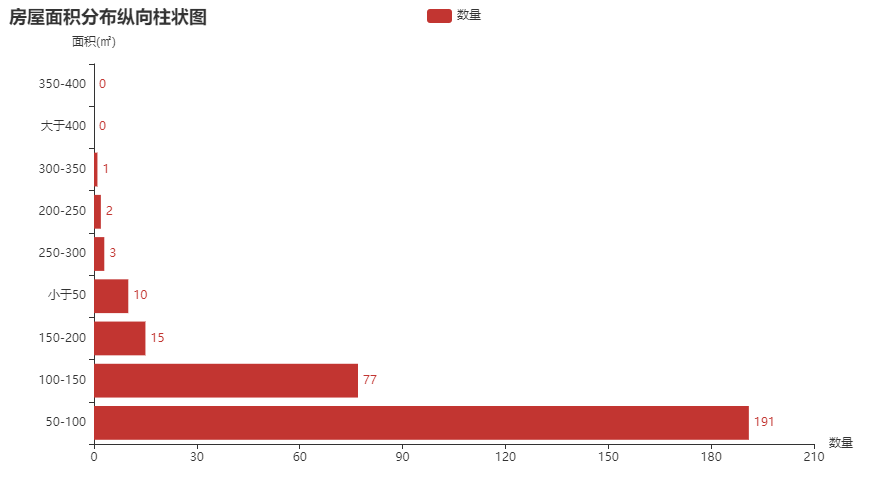
area = df_area.index.tolist()
count = df_area.values.tolist()

bar = (
    Bar()
    .add_xaxis(area)
    .add_yaxis('数量', count)
    .reversal_axis()
    .set_series_opts(label_opts=opts.LabelOpts(position="right"))
    .set_global_opts(
        title_opts=opts.TitleOpts(title='房屋面积分布纵向柱状图'),
        yaxis_opts=opts.AxisOpts(name='面积(㎡)'),
        xaxis_opts=opts.AxisOpts(name='数量'),
    )
)
bar.render_notebook()