使用echarts5.0版本实现中国地图,E charts在5.0版本之后,地图不能直接引入了,需要自己去下载。
地图文件下载地址:
下载地址
(http://datav.aliyun.com/portal/school/atlas/area_selector#&lat=30.772340792178525&lng=103.94573258937584&zoom=9.5)
注意: 将下载后的json文件放置/public目录下
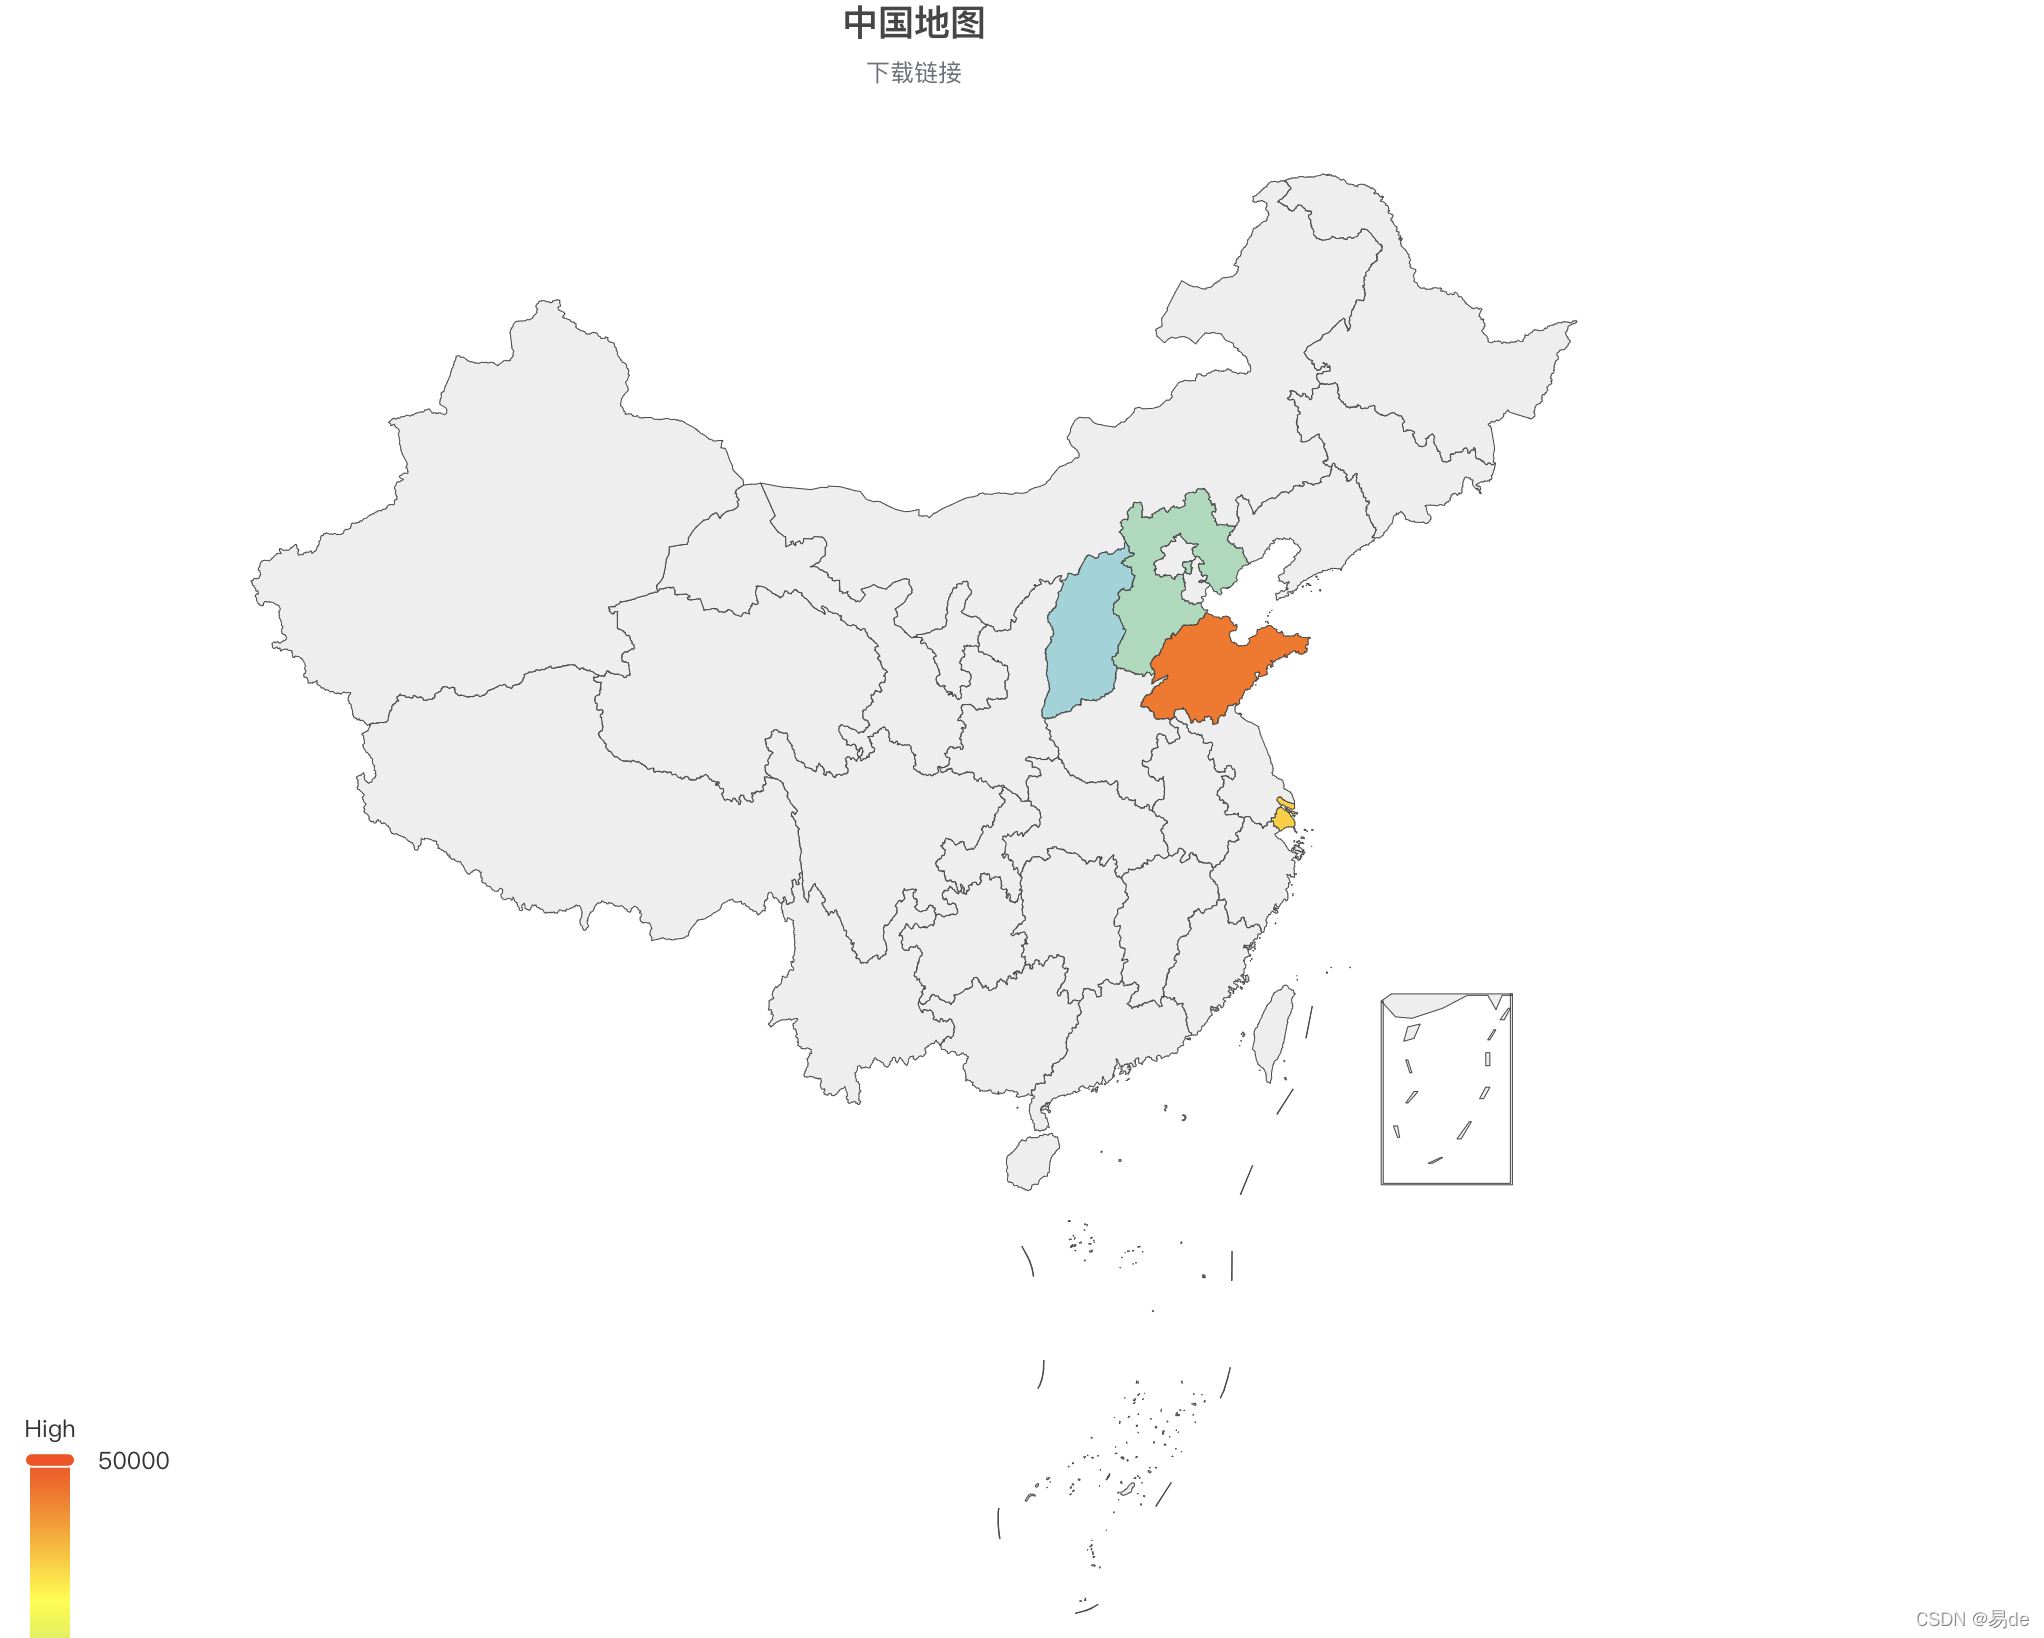
map类型的地图
<template>
    <div>
        <div ref="mapEcharts" class="map-echart"></div>
    </div>

</template>

<script>
import * as echarts from 'echarts'
import axios from 'axios'

export default {
  name: "Map",
  data() {
    return {
      timer: null,
      seriesData: [
        {name: '天津市', value: 20057.34},
        {name: '北京市', value: 15477.48},
        {name: '上海市', value: 31686.1},
        {name: '河北省', value: 6992.6},
        {name: '山东省', value: 44045.49},
        {name: '山西省', value: 4045.49},
      ],
      map: null
    }

  },
  created() {

  },
  mounted(){
      this.initMapEcharts();
  },
  methods: {
    initMapEcharts() {
      // 获取地图数据
      // 将下载后的json文件放置/public目录下
      axios.get('/china.json').then(res => {
          console.log(res);
         // 使用数据注册地图
         echarts.registerMap('china', res.data)
          this.$nextTick(() => {
            // 初始化地图
            this.map = echarts.init(this.$refs['mapEcharts'])
            // 设置基础配置项
            const option = {
              // 标题
              title: {
                text:"中国地图",
                left: 'center',
                subtext: "下载链接",
                sublink: "http://datav.aliyun.com/tools/atlas/#&lat=30.772340792178525&lng=103.94573258937584&zoom=9.5"
              },
              // 悬浮窗
              tooltip: {
                trigger: 'item',
                formatter: function(params) {
                  return `${params.name}: ${params.value || 0}`

                }
              },
              // 图例
              visualMap: {
                min: 800,
                max: 50000,
                text: ['High', 'Low'],
                realtime: false,
                calculable: true,
                inRange: {
                    color: ['lightskyblue', 'yellow', 'orangered']
                }
              },
              // 要显示的散点数据
              series: [
                {
                  type: 'map',
                  map: 'china',
                  // 这是要显示的数据
                  data: this.seriesData,
                  // 自定义命名映射,不设置的话,label默认是使用 geoJson中的name名
                  nameMap: {
                    '北京市': "北京重命名",
                    "天津市": '天津重命名'
                  },
                },

              ]
            }
            // 将配置应用到地图上
            this.map.setOption(option)
            // 设置定时器,自动循环触发tooltip悬浮窗事件
            this.setTimer()
            let that = this;
            // 当鼠标在地图上时,停止自动tooltip事件
            this.map.on('mouseover', {series: 0,}, function(params) {
              that.clearTimer()
            })
            // 当鼠标移出地图后,再自动tooltip
            this.map.on('mouseout', {series: 0}, function(params) {
              that.setTimer()
            })
          })
      })
    },
    setTimer() {
      // 当前选中区域的下标
      let curIndex = -1;
      this.timer && clearInterval(this.timer)
      this.timer = setInterval(() => {
        const len = this.seriesData.length;
        // dispatchAction是主动去触发echarts事件,取消高亮当前的数据图形
        this.map.dispatchAction({
          type: 'downplay',
          seriesIndex: 0,
          dataIndex: curIndex
        })
        // 下一个选中区域的下标
        curIndex = (curIndex + 1) % len;
        // 高亮下一个数据图形
        this.map.dispatchAction({
          type: 'highlight',
          seriesIndex: 0,
          dataIndex: curIndex
        })
        // 显示tooltip
        this.map.dispatchAction({
          type: 'showTip',
          seriesIndex:0,
          dataIndex: curIndex
        })
      }, 1000)
    },
    clearTimer() {
      this.timer && clearInterval(this.timer)
    },
  },

  beforeDestroy() {
    this.clearTimer()
  }
}
</script>

<style>
.map-echart {
  height: 900px;
  width: 900px;
}
</style>
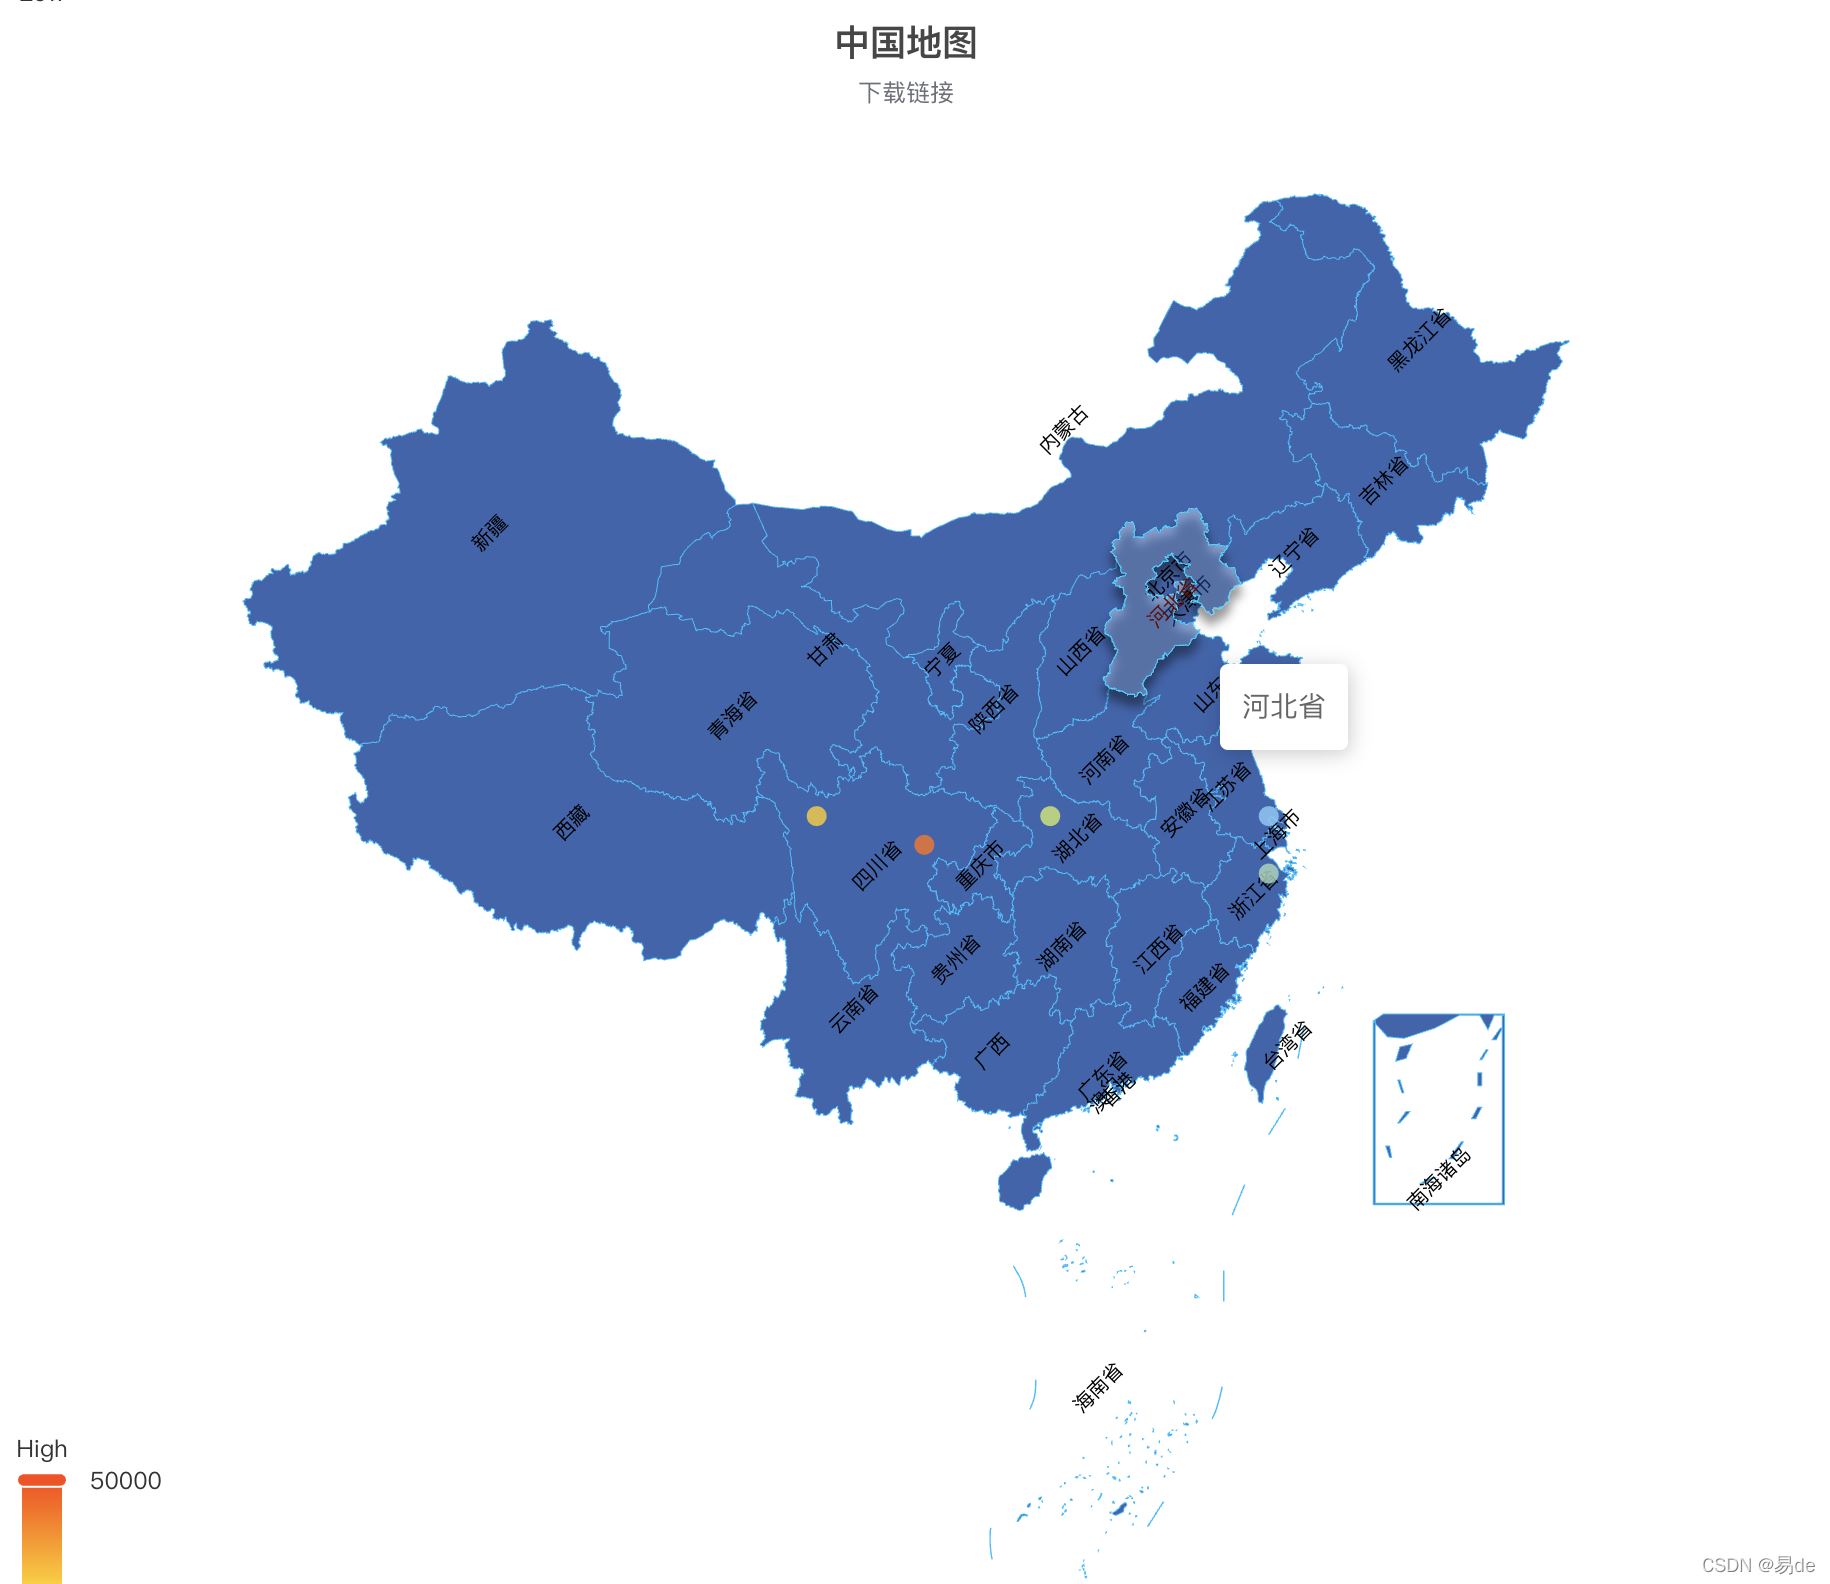
geo类型地图
<template>
    <div>
        <div ref="geoEcharts" class="geo-echart"></div>
    </div>

</template>

<script>
import * as echarts from 'echarts'
import axios from 'axios'
import { color } from 'echarts'

export default {
  name: "Geo",
  data() {
    return {
      timer: null,
      seriesData: [
        {name: '天津市', value: 20057.34},
        {name: '北京市', value: 15477.48},
        {name: '上海市', value: 31686.1},
        {name: '河北省', value: 6992.6},
        {name: '山东省', value: 44045.49},
        {name: '山西省', value: 4045.49},
      ],
      map: null
    }

  },
  created() {

  },
  mounted(){
      this.initGeoEcharts();
  },
  methods: {
    initGeoEcharts() {
      axios.get('/china.json').then(res => {
         echarts.registerMap('china', res.data)
          this.$nextTick(() => {
            const map = echarts.init(this.$refs['geoEcharts'], null, {renderer:'svg'})
            const option = {
              title: {
                text:"中国地图",
                left: 'center',
                subtext: "下载链接",
                sublink: "http://datav.aliyun.com/tools/atlas/#&lat=30.772340792178525&lng=103.94573258937584&zoom=9.5"
              },
              // 悬浮窗
              tooltip: {
                trigger: 'item',
                formatter: function(params) {
                  console.log(2222, params);
                  return `${params.name}: ${params.value || 0}`

                }
              },
              // 图例
              visualMap: {
                min: 800,
                max: 50000,
                text: ['High', 'Low'],
                realtime: false,
                calculable: true,
                inRange: {
                    color: ['lightskyblue', 'yellow', 'orangered']
                }
              },
              geo: {
                map: 'china',
                zoom: 1,
                roam: 'move',
                nameMap: {
                  '新疆维吾尔自治区': "新疆",
                  "西藏自治区": '西藏',
                  "甘肃省": "甘肃",
                  "宁夏回族自治区": "宁夏",
                  "广西壮族自治区": "广西",
                  "内蒙古自治区": "内蒙古",
                  "香港特别行政区": "香港",
                  "澳门特别行政区": "澳门"
                },
                label: {
                  show: true,
                  color: 'black',
                  position: "inside",
                  distance: 0,
                  fontSize: 10,
                  rotate:45
                },
                // 所有地图的区域颜色
                itemStyle: {
                  areaColor: 'rgba(0,60,153,0.8)',
                  borderColor: '#02c0ff'
                },
                emphasis: {
                  itemStyle: {
                    areaColor: 'rgba(0,60,153,0.5)',
                    shadowColor: 'rgba(0,0,0,0.8)',
                    shadowBlur: 5,
                    shadowOffsetY: 5
                  }
                },
                // 针对某些区域做一些特别的样式
                // regions: [{
                //   name: '广东省',
                //   itemStyle: {
                //     areaColor: 'yellow',
                //     color: 'black',
                //     borderColor: 'pink'
                //   }
                // }]
              },
              // 数据
              series: [
                {
                  type: 'scatter',
                  coordinateSystem: 'geo',
            	  data: [
                    {name: '江苏省', value:[120.15, 31.99, 9]}, // 值为,经纬度,数据
                    {name: '湖北省', value: [111, 31.89, 15477]},
                    {name: '四川省', value: [102.15, 31.89, 31686]},
                    {name: '浙江省', value: [120.15, 29.89, 6992]},
                    {name: '山东省', value: [118.15, 36.9, 44045]}
                  ],
                  SymbolSize: 4
                },
                {
                  type: 'lines',
                  coordinateSystem: 'geo',
                  data: [
                    {coords: [[121.15,38], [111, 31.89], [100.15, 31.89],[121.15, 29.89], [105.15, 30.89]]}
                  ],
                  polyline: true, // 是否是多段线
                  lineStyle: {
                    color: {
                      type: 'radial',
                      x: 0.5,
                      y: 0.5,
                      r: 0.5,
                      colorStops: [{
                          offset: 0, color: 'red' // 0% 处的颜色
                      }, {
                          offset: 1, color: 'blue' // 100% 处的颜色
                      }],
                      global: false, // 缺省为 false
                      shadowColor: 'rgba(0, 0, 0, 0.5)',
                      shadowBlur: 10,
                      curveness: 1
                    },
                    opacity: 0.3,
                    width: 2,
                  },
                  // 线特效的配置
                  effect: {
                    show: true,
                    period: 5, // 特效动画的时间,单位为 s
                    trailLength: 1, //特效尾迹长度[0,1]值越大,尾迹越长重
                    // symbol: 'image://' + require('@/echartsMap/money.png'), // 自定义动画图标
                    symbolSize: 15, //图标大小
                    color:"red"
                  }
                }

              ]
            }
            map.setOption(option)
          })
      })
    }
  },
}
</script>

<style>
.geo-echart{
  height: 900px;
  width: 900px;
}
</style>
到此这篇关于vue+echarts5实现中国地图的示例代码的文章就介绍到这了,更多相关vue echarts5中国地图内容请搜索以前的文章或继续浏览下面的相关文章希望大家以后多多支持!

