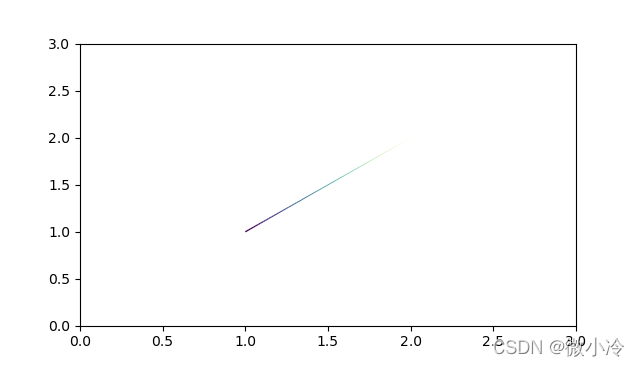
流星雨的前提是得先有一个流星,所谓流星,就是一个拖着尾巴的直线。所谓拖着尾巴,实际上是我们的浪漫想象,实质无非是尺寸和颜色的渐变罢了。
而matplotlib并不能给一条曲线映射多个颜色,故而可将一条线拆分成多条,效果如图所示
代码为
import numpy as np
import matplotlib.pyplot as plt
from matplotlib.collections import LineCollection

x0,y0 = 1,1     #此为流星位置
ts = np.arange(0,1,0.01)    #参数
xs,ys = x0+ts, y0+ts        #绘图线条

points = np.array([xs, ys]).T.reshape(-1, 1, 2)
segments = np.concatenate([points[:-1], points[1:]], axis=1)

ax = plt.subplot()
lc = LineCollection(segments, cmap='viridis')

lc.set_array(ts)
lc.set_linewidth(ts[::-1])
line = ax.add_collection(lc)

ax.set_xlim(0, 3)
ax.set_ylim(0, 3)
plt.show()
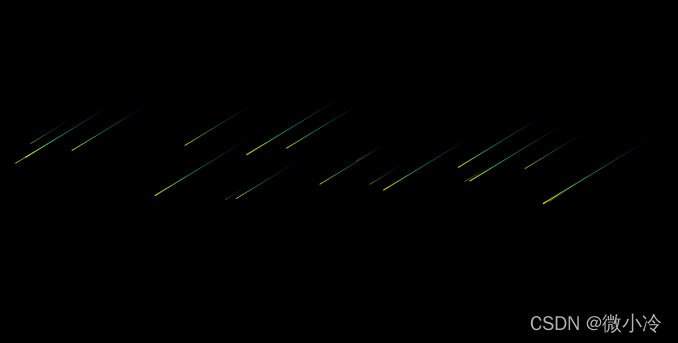
接下来就要把这个流星变成流星雨,很简单,多加一些流星就可以了,效果如下,尽管是在白天,但是不是感觉有点意思了。

代码为
from numpy.random import rand, randint
N,L = 20,100  #流星个数和线段数
ts = np.array([
    np.linspace(0,rand(),L) for _ in range(N)]).T
x0,y0 = rand(2*N).reshape(2,1,N)
x0 *= 5
xs,ys = x0+ts, y0+ts #绘图线条1

points = np.array([xs, ys]).T.reshape(N,L,-1,2)

ax = plt.subplot()
for i in range(N):
    segs = np.concatenate([points[i][:-1], points[i][1:]], axis=1)
    lc = LineCollection(segs, cmap='viridis')
    lc.set_array(ts[:,i])
    lc.set_linewidth(ts[::-1,i])
    ax.add_collection(lc)

ax.set_xlim(0, 6)
ax.set_ylim(-2, 3)
ax.set_axis_off()                      #取消坐标轴
plt.show()
如果想让天黑下去,方法为
plt.figure(facecolor="black") #将背景设为黑色
此外,背景设为黑色之后,注意要把颜色映射调整一下,想知道更多具体的颜色映射表戳这里:matplotlib中的伪彩映射
lc = LineCollection(segs, cmap='viridis_r')
所以就是这种
本篇文章就到这里了,希望能够给你带来帮助,也希望您能够多多关注的更多内容!

