import cv2 as cv
import numpy as np
import matplotlib.pyplot as plt
# 设置兼容中文
plt.rcParams['font.family'] = ['sans-serif']
plt.rcParams['font.sans-serif'] = ['SimHei']
D:\Anaconda\AZWZ\lib\site-packages\numpy\_distributor_init.py:30: UserWarning: loaded more than 1 DLL from .libs:

D:\Anaconda\AZWZ\lib\site-packages\numpy\.libs\libopenblas.NOIJJG62EMASZI6NYURL6JBKM4EVBGM7.gfortran-win_amd64.dll

D:\Anaconda\AZWZ\lib\site-packages\numpy\.libs\libopenblas.WCDJNK7YVMPZQ2ME2ZZHJJRJ3JIKNDB7.gfortran-win_amd64.dll

  warnings.warn("loaded more than 1 DLL from .libs:\n%s" %

cv.__version__

'4.5.1'
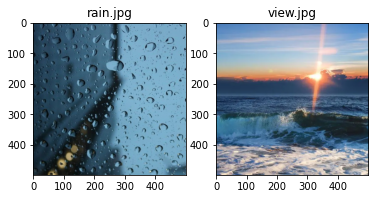
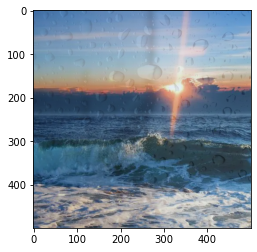
rain = cv.imread('img/rain.jpg')[:500,:500,:]

view = cv.imread('img/view.jpg')

print(rain.shape)

print(view.shape)

(500, 500, 3)

(500, 500, 3)
plt.figure()

plt.subplot(1,2,1)

m1 = plt.imshow(rain[:,:,::-1])

plt.title('rain.jpg')

plt.subplot(1,2,2)

m2 = plt.imshow(view[:,:,::-1])

plt.title('view.jpg')
Text(0.5, 1.0, 'view.jpg')
# cv加法
add_img = cv.add(rain,view)
plt.imshow(add_img[:,:,::-1])
<matplotlib.image.AxesImage at 0x1fdc2fed160>
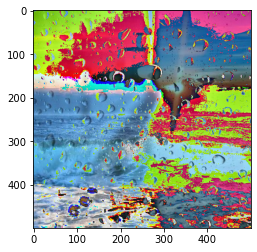
# numpy 加法
add_img2 = rain + view
plt.imshow(add_img2[:,:,::-1])
<matplotlib.image.AxesImage at 0x1fdc2d4d4c0>
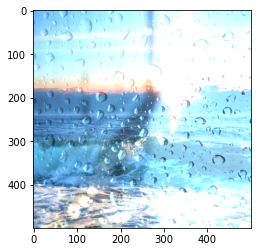
# 图像的混合(按照权重)
img3 = cv.addWeighted(rain,0.2,view,0.8,0)
plt.imshow(img3[:,:,::-1])
<matplotlib.image.AxesImage at 0x1fdc2f01a00>
# 获取绝对尺寸 行,列
row,col = rain.shape[:2]
print("row:",row,",col:",col)
row: 500 ,col: 500
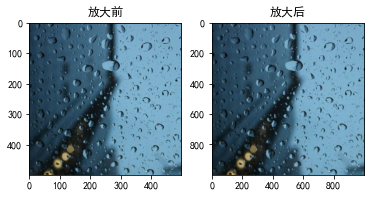
# 图像放大
res = cv.resize(rain,(2*row,2*col))
plt.figure()
plt.subplot(1,2,1)
m1 = plt.imshow(rain[:,:,::-1])
plt.title("放大前")
plt.subplot(1,2,2)
m2 = plt.imshow(res[:,:,::-1])
plt.title("放大后")
Text(0.5, 1.0, '放大后')
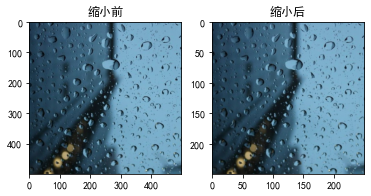
# 使用相对坐标 进行图像缩小
res2 = cv.resize(rain,None,fx=0.5,fy=0.5)
plt.figure()
plt.subplot(1,2,1)
m1 = plt.imshow(rain[:,:,::-1])
plt.title("缩小前")
plt.subplot(1,2,2)
m2 = plt.imshow(res2[:,:,::-1])
plt.title("缩小后")

Text(0.5, 1.0, '缩小后')
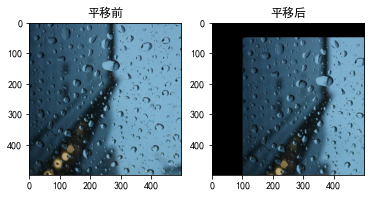
# 创建平移矩阵  x方向上平移100,y方向上平移50
M = np.float32([[1,0,100],[0,1,50]])
M

array([[  1.,   0., 100.],
       [  0.,   1.,  50.]], dtype=float32)

# cv.warpAffine(要平移的图形,平移矩阵,背景画布大小)
res = cv.warpAffine(rain,M,rain.shape[:2])

plt.figure()
plt.subplot(1,2,1)
m1 = plt.imshow(rain[:,:,::-1])
plt.title("平移前")
plt.subplot(1,2,2)
m2 = plt.imshow(res[:,:,::-1])
plt.title("平移后")

Text(0.5, 1.0, '平移后')
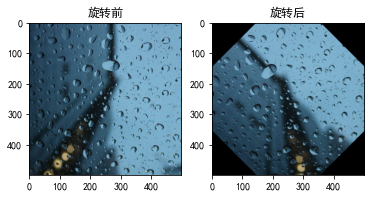
row,col = rain.shape[:2]

# 生成旋转矩阵 getRotationMatrix2D(旋转中心坐标,旋转角度,缩放比例)
M = cv.getRotationMatrix2D((row/2,col/2),45,1)

# cv.warpAffine(要旋转的图形,旋转矩阵,背景画布大小)
res = cv.warpAffine(rain,M,(col,row))

plt.figure()
plt.subplot(1,2,1)
m1 = plt.imshow(rain[:,:,::-1])
plt.title("旋转前")
plt.subplot(1,2,2)
m2 = plt.imshow(res[:,:,::-1])
plt.title("旋转后")

Text(0.5, 1.0, '旋转后')
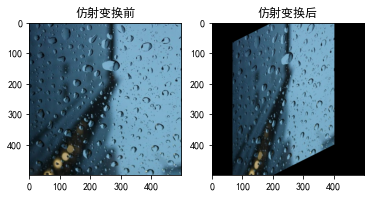
pts1 = np.float32([[50,50],[200,50],[50,200]])
pts2 = np.float32([[100,100],[200,50],[100,250]])

M = cv.getAffineTransform(pts1,pts2)
M

array([[ 0.66666667,  0.        , 66.66666667],
       [-0.33333333,  1.        , 66.66666667]])

res = cv.warpAffine(rain,M,rain.shape[:2])

plt.figure()
plt.subplot(1,2,1)
m1 = plt.imshow(rain[:,:,::-1])
plt.title("仿射变换前")
plt.subplot(1,2,2)
m2 = plt.imshow(res[:,:,::-1])
plt.title("仿射变换后")

Text(0.5, 1.0, '仿射变换后')
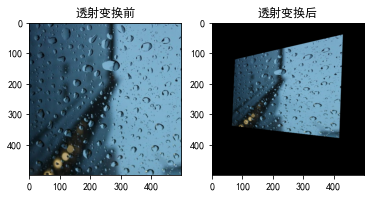
pst1 = np.float32([[56,65],[368,52],[28,387],[389,390]])
pst2 = np.float32([[100,145],[300,100],[80,290],[310,300]])

M = cv.getPerspectiveTransform(pst1,pst2)
M

array([[ 3.98327670e-01, -2.09876559e-02,  7.49460064e+01],
       [-1.92233080e-01,  4.29335771e-01,  1.21896057e+02],
       [-7.18774228e-04, -1.33393850e-05,  1.00000000e+00]])

res = cv.warpPerspective(rain,M,rain.shape[:2])

plt.figure()
plt.subplot(1,2,1)
m1 = plt.imshow(rain[:,:,::-1])
plt.title("透射变换前")
plt.subplot(1,2,2)
m2 = plt.imshow(res[:,:,::-1])
plt.title("透射变换后")

Text(0.5, 1.0, '透射变换后')
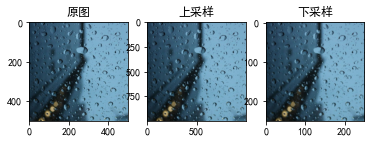
# 上采样

img_up = cv.pyrUp(rain)
# 下采样

img_down = cv.pyrDown(rain)
plt.figure()

plt.subplot(1,3,1)

m1 = plt.imshow(rain[:,:,::-1])

plt.title("原图")

plt.subplot(1,3,2)

m2 = plt.imshow(img_up[:,:,::-1])

plt.title("上采样")

plt.subplot(1,3,3)

m2 = plt.imshow(img_down[:,:,::-1])

plt.title("下采样")
Text(0.5, 1.0, '下采样')