前言:
VTK,(visualizationtoolkit)是一个开放资源的免费软件系统,主要用于三维计算机图形学、图像处理和可视化。Vtk是在面向对象原理的基础上设计和实现的,它的内核是用C++构建的,包含有大约250,000行代码,2000多个类,还包含有几个转换界面,因此也可以自由的通过Java,Tcl/Tk和Python各种语言使用vtk。
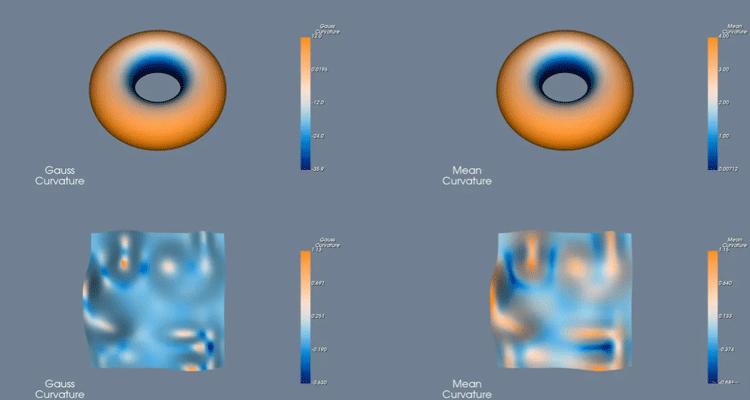
本文介绍了 如何使用户Python版本的VTK计算曲面的高斯曲率并映射在曲面上。本例中使用了两个不同的表面,每个表面根据其高斯曲率和平均曲率着色。
为了获得漂亮的彩色图像,使用VTKColorTransfer函数为vtkLookupTable表生成一组颜色。我们使用了发散的颜色空间。由于为查找表选择的范围对称,白色表示中点值,而蓝色表示小于中点值的值,橙色表示大于中点值的颜色。在随机Hills高斯曲率曲面的情况下,这种颜色非常好地显示了曲面的性质。蓝色区域为鞍点(负高斯曲率),橙色区域为正高斯曲率。在平均曲率的情况下,蓝色表示垂直于一个主轴的负曲率。
主要函数介绍:
vtkSuperquadricSource: vtkSuperquadricSource 创建以原点为中心的多边形超二次曲面,可以设置尺寸。可以设置两个(φ)的纬度和经度(θ)方向的分辨率(多边形离散化)。浑圆度参数(纬度浑圆度和经度浑圆度)控制超二次曲面的形状。环形布尔值控制是否产生环形的超二次曲面。如果是的话,厚度参数控制的厚度的环形:0是最薄的环形,和1具有最小尺寸的孔。缩放尺度参数允许超二次曲面,在x,y,和z(在任何情况下,正确地生成法线向量)进行缩放。 尺寸参数控制的超二次曲面的size。原理是基于“刚性基于物理的超二次曲面”。
基本方法:
vtkParametricRandomHills: 生成覆盖随机放置的山丘的曲面。山丘的形状和高度会有所不同,因为附近山丘的存在会影响给定山丘的形状和高度。提供了一个选项,用于将山丘放置在曲面上的规则栅格上。在这种情况下,所有山丘的形状和高度都相同。
adjust_edge_curvatures: 此函数通过将该值替换为邻域中点曲率的平均值来调整曲面边缘的曲率。在调用此函数之前,请记住更新vtkCurvatures对象。
source:与vtkCurvatures对象相对应的vtkPolyData对象。
curvature_name:曲率的名称,“Gauss_curvature”或“Mean_curvature”。
epsilon:小于此值的绝对曲率值将设置为零。
mport numpy as np
import vtk
from vtk.util import numpy_support
from vtkmodules.numpy_interface import dataset_adapter as dsa

def main(argv):
    colors = vtk.vtkNamedColors()
    #产生曲面
    torus = vtk.vtkSuperquadricSource()
    torus.SetCenter(0.0, 0.0, 0.0)
    torus.SetScale(1.0, 1.0, 1.0)
    torus.SetPhiResolution(64)
    torus.SetThetaResolution(64)
    torus.SetThetaRoundness(1)
    torus.SetThickness(0.5)
    torus.SetSize(0.5)
    torus.SetToroidal(1)

    # 改变观察视角
    toroid_transform = vtk.vtkTransform()
    toroid_transform.RotateX(55)

    toroid_transform_filter = vtk.vtkTransformFilter()
    toroid_transform_filter.SetInputConnection(torus.GetOutputPort())
    toroid_transform_filter.SetTransform(toroid_transform)

    # The quadric is made of strips, so pass it through a triangle filter as
    # the curvature filter only operates on polys
    tri = vtk.vtkTriangleFilter()
    tri.SetInputConnection(toroid_transform_filter.GetOutputPort())

    #二次曲面在生成边的方式上存在严重的不连续性,因此让我们将其通过CleanPolyDataFilter并合并
    #任何重合或非常接近的点

    cleaner = vtk.vtkCleanPolyData()
    cleaner.SetInputConnection(tri.GetOutputPort())
    cleaner.SetTolerance(0.005)
    cleaner.Update()

    # 生成覆盖随机放置的山丘的曲面
    rh = vtk.vtkParametricRandomHills()
    rh_fn_src = vtk.vtkParametricFunctionSource()
    rh_fn_src.SetParametricFunction(rh)
    rh_fn_src.Update()

    sources = list()
    for i in range(0, 4):
        cc = vtk.vtkCurvatures()
        if i < 2:
            cc.SetInputConnection(cleaner.GetOutputPort())
        else:
            cc.SetInputConnection(rh_fn_src.GetOutputPort())
        if i % 2 == 0:
            cc.SetCurvatureTypeToGaussian()
            curvature_name = 'Gauss_Curvature'
        else:
            cc.SetCurvatureTypeToMean()
            curvature_name = 'Mean_Curvature'
        cc.Update()
        adjust_edge_curvatures(cc.GetOutput(), curvature_name)
        sources.append(cc.GetOutput())

    curvatures = {
        0: 'Gauss_Curvature',
        1: 'Mean_Curvature',
        2: 'Gauss_Curvature',
        3: 'Mean_Curvature',
    }

    # lut = get_diverging_lut()
    lut = get_diverging_lut1()

    renderers = list()
    mappers = list()
    actors = list()
    text_mappers = list()
    text_actors = list()
    scalar_bars = list()

    # Create a common text property.
    text_property = vtk.vtkTextProperty()
    text_property.SetFontSize(24)
    text_property.SetJustificationToCentered()

    # RenderWindow Dimensions
    #
    renderer_size = 512
    grid_dimensions = 2
    window_width = renderer_size * grid_dimensions
    window_height = renderer_size * grid_dimensions


    for idx, source in enumerate(sources):
        curvature_name = curvatures[idx].replace('_', '\n')

        source.GetPointData().SetActiveScalars(curvatures[idx])
        scalar_range = source.GetPointData().GetScalars(curvatures[idx]).GetRange()

        mappers.append(vtk.vtkPolyDataMapper())
        mappers[idx].SetInputData(source)
        mappers[idx].SetScalarModeToUsePointFieldData()
        mappers[idx].SelectColorArray(curvatures[idx])
        mappers[idx].SetScalarRange(scalar_range)
        mappers[idx].SetLookupTable(lut)

        actors.append(vtk.vtkActor())
        actors[idx].SetMapper(mappers[idx])

        text_mappers.append(vtk.vtkTextMapper())
        text_mappers[idx].SetInput(curvature_name)
        text_mappers[idx].SetTextProperty(text_property)

        text_actors.append(vtk.vtkActor2D())
        text_actors[idx].SetMapper(text_mappers[idx])
        text_actors[idx].SetPosition(250, 16)

        # Create a scalar bar
        scalar_bars.append(vtk.vtkScalarBarActor())
        scalar_bars[idx].SetLookupTable(mappers[idx].GetLookupTable())
        scalar_bars[idx].SetTitle(curvature_name)
        scalar_bars[idx].UnconstrainedFontSizeOn()
        scalar_bars[idx].SetNumberOfLabels(5)
        scalar_bars[idx].SetMaximumWidthInPixels(window_width // 8)
        scalar_bars[idx].SetMaximumHeightInPixels(window_height // 3)
        scalar_bars[idx].SetBarRatio(scalar_bars[idx].GetBarRatio() * 0.5)
        scalar_bars[idx].SetPosition(0.85, 0.1)

        renderers.append(vtk.vtkRenderer())

    for idx in range(len(sources)):
        if idx < grid_dimensions * grid_dimensions:
            renderers.append(vtk.vtkRenderer)

    # Create the RenderWindow
    #
    render_window = vtk.vtkRenderWindow()
    render_window.SetSize(renderer_size * grid_dimensions, renderer_size * grid_dimensions)
    render_window.SetWindowName('CurvaturesDemo')


    viewport = list()
    for row in range(grid_dimensions):
        for col in range(grid_dimensions):
            idx = row * grid_dimensions + col

            viewport[:] = []
            viewport.append(float(col) / grid_dimensions)
            viewport.append(float(grid_dimensions - (row + 1)) / grid_dimensions)
            viewport.append(float(col + 1) / grid_dimensions)
            viewport.append(float(grid_dimensions - row) / grid_dimensions)

            if idx > (len(sources) - 1):
                continue

            renderers[idx].SetViewport(viewport)
            render_window.AddRenderer(renderers[idx])

            renderers[idx].AddActor(actors[idx])
            renderers[idx].AddActor(text_actors[idx])
            renderers[idx].AddActor(scalar_bars[idx])
            renderers[idx].SetBackground(colors.GetColor3d('SlateGray'))

    interactor = vtk.vtkRenderWindowInteractor()
    interactor.SetRenderWindow(render_window)
    style = vtk.vtkInteractorStyleTrackballCamera()
    interactor.SetInteractorStyle(style)

    render_window.Render()

    interactor.Start()


def get_diverging_lut():

    ctf = vtk.vtkColorTransferFunction()
    ctf.SetColorSpaceToDiverging()
    # Cool to warm.
    ctf.AddRGBPoint(0.0, 0.230, 0.299, 0.754)
    ctf.AddRGBPoint(0.5, 0.865, 0.865, 0.865)
    ctf.AddRGBPoint(1.0, 0.706, 0.016, 0.150)

    table_size = 256
    lut = vtk.vtkLookupTable()
    lut.SetNumberOfTableValues(table_size)
    lut.Build()

    for i in range(0, table_size):
        rgba = list(ctf.GetColor(float(i) / table_size))
        rgba.append(1)
        lut.SetTableValue(i, rgba)

    return lut


def get_diverging_lut1():
    colors = vtk.vtkNamedColors()
    # Colour transfer function.
    ctf = vtk.vtkColorTransferFunction()
    ctf.SetColorSpaceToDiverging()
    p1 = [0.0] + list(colors.GetColor3d('MidnightBlue'))
    p2 = [0.5] + list(colors.GetColor3d('Gainsboro'))
    p3 = [1.0] + list(colors.GetColor3d('DarkOrange'))
    ctf.AddRGBPoint(*p1)
    ctf.AddRGBPoint(*p2)
    ctf.AddRGBPoint(*p3)

    table_size = 256
    lut = vtk.vtkLookupTable()
    lut.SetNumberOfTableValues(table_size)
    lut.Build()

    for i in range(0, table_size):
        rgba = list(ctf.GetColor(float(i) / table_size))
        rgba.append(1)
        lut.SetTableValue(i, rgba)

    return lut


def vtk_version_ok(major, minor, build):

    requested_version = (100 * int(major) + int(minor)) * 100000000 + int(build)
    ver = vtk.vtkVersion()
    actual_version = (100 * ver.GetVTKMajorVersion() + ver.GetVTKMinorVersion()) \
                     * 100000000 + ver.GetVTKBuildVersion()
    if actual_version >= requested_version:
        return True
    else:
        return False


def adjust_edge_curvatures(source, curvature_name, epsilon=1.0e-08):

    def point_neighbourhood(pt_id):

        cell_ids = vtk.vtkIdList()
        source.GetPointCells(pt_id, cell_ids)
        neighbour = set()
        for cell_idx in range(0, cell_ids.GetNumberOfIds()):
            cell_id = cell_ids.GetId(cell_idx)
            cell_point_ids = vtk.vtkIdList()
            source.GetCellPoints(cell_id, cell_point_ids)
            for cell_pt_idx in range(0, cell_point_ids.GetNumberOfIds()):
                neighbour.add(cell_point_ids.GetId(cell_pt_idx))
        return neighbour

    def compute_distance(pt_id_a, pt_id_b):

        #计算距离.


        pt_a = np.array(source.GetPoint(pt_id_a))
        pt_b = np.array(source.GetPoint(pt_id_b))
        return np.linalg.norm(pt_a - pt_b)

    # 获取活动标量
    source.GetPointData().SetActiveScalars(curvature_name)
    np_source = dsa.WrapDataObject(source)
    curvatures = np_source.PointData[curvature_name]

    #  获得边缘点的ID
    array_name = 'ids'
    id_filter = vtk.vtkIdFilter()
    id_filter.SetInputData(source)
    id_filter.SetPointIds(True)
    id_filter.SetCellIds(False)
    id_filter.SetPointIdsArrayName(array_name)
    id_filter.SetCellIdsArrayName(array_name)
    id_filter.Update()

    edges = vtk.vtkFeatureEdges()
    edges.SetInputConnection(id_filter.GetOutputPort())
    edges.BoundaryEdgesOn()
    edges.ManifoldEdgesOff()
    edges.NonManifoldEdgesOff()
    edges.FeatureEdgesOff()
    edges.Update()

    edge_array = edges.GetOutput().GetPointData().GetArray(array_name)
    boundary_ids = []
    for i in range(edges.GetOutput().GetNumberOfPoints()):
        boundary_ids.append(edge_array.GetValue(i))
    # Remove duplicate Ids.
    p_ids_set = set(boundary_ids)

    #迭代边缘点并计算曲率作为相邻点的加权平均值。
    count_invalid = 0
    for p_id in boundary_ids:
        p_ids_neighbors = point_neighbourhood(p_id)
        # Keep only interior points.
        p_ids_neighbors -= p_ids_set
        # Compute distances and extract curvature values.
        curvs = [curvatures[p_id_n] for p_id_n in p_ids_neighbors]
        dists = [compute_distance(p_id_n, p_id) for p_id_n in p_ids_neighbors]
        curvs = np.array(curvs)
        dists = np.array(dists)
        curvs = curvs[dists > 0]
        dists = dists[dists > 0]
        if len(curvs) > 0:
            weights = 1 / np.array(dists)
            weights /= weights.sum()
            new_curv = np.dot(curvs, weights)
        else:
            # Corner case.
            count_invalid += 1
            # Assuming the curvature of the point is planar.
            new_curv = 0.0
        # Set the new curvature value.
        curvatures[p_id] = new_curv

    #  将小值设置为0
    if epsilon != 0.0:
        curvatures = np.where(abs(curvatures) < epsilon, 0, curvatures)
        # Curvatures is now an ndarray
        curv = numpy_support.numpy_to_vtk(num_array=curvatures.ravel(),
                                          deep=True,
                                          array_type=vtk.VTK_DOUBLE)
        curv.SetName(curvature_name)
        source.GetPointData().RemoveArray(curvature_name)
        source.GetPointData().AddArray(curv)
        source.GetPointData().SetActiveScalars(curvature_name)


if __name__ == '__main__':
    import sys

    main(sys.argv)
显示效果如下: