<template>
  <el-container>
    <el-header>
      <el-menu :default-active="activeIndex" class="el-menu-header" mode="horizontal" @select="handleSelect">
        <el-menu-item index="1"><router-link :to="{path: '/yun/index' }">首页</router-link></el-menu-item>
        <el-menu-item index="2"><router-link :to="{path: '/yun/list' }">服务器列表</router-link></el-menu-item>
        <el-menu-item index="3">控制台</el-menu-item>
        <el-menu-item index="4">消息中心</el-menu-item>
        <el-menu-item index="5"><router-link :to="{path: '/yun/about' }">关于我们</router-link></el-menu-item>
        <el-menu-item @click="toLogin()" v-if="userName === ''">登录</el-menu-item>
        <el-menu-item>
        <el-dropdown>
          <span class="el-dropdown-link" v-if="userName !== ''">
            {{ userName }}<i class="el-icon-arrow-down el-icon--right"></i>
          </span>
          <el-dropdown-menu slot="dropdown" v-if="userName!==''">
<!--            <el-dropdown-item>登录</el-dropdown-item>-->
            <el-dropdown-item @click.native="toLogout">退出</el-dropdown-item>
          </el-dropdown-menu>
        </el-dropdown>
        </el-menu-item>
      </el-menu>
    </el-header>
    <el-container  style="height: 620px; border: 1px solid #eee">
      <el-aside width="200px">
        <el-menu
          default-active="1"
          class="el-menu-vertical-demo"
          @open="handleOpen"
          @close="handleClose">
          <el-submenu index="1">
            <template slot="title">
              <i class="el-icon-location"></i>
              <span>服务器列表</span>
            </template>
            <el-menu-item-group>
              <template slot="title">分组一</template>
              <el-menu-item index="1-1">选项1</el-menu-item>
              <el-menu-item index="1-2">选项2</el-menu-item>
            </el-menu-item-group>
            <el-menu-item-group title="分组2">
              <el-menu-item index="1-3">选项3</el-menu-item>
            </el-menu-item-group>
            <el-submenu index="1-4">
              <template slot="title">选项4</template>
              <el-menu-item index="1-4-1">选项1</el-menu-item>
            </el-submenu>
          </el-submenu>
          <el-menu-item index="2">
            <i class="el-icon-menu"></i>
            <span slot="title">导航二</span>
          </el-menu-item>
          <el-menu-item index="3" disabled>
            <i class="el-icon-document"></i>
            <span slot="title">导航三</span>
          </el-menu-item>
          <el-menu-item index="4">
            <i class="el-icon-setting"></i>
            <span slot="title">导航四</span>
          </el-menu-item>
        </el-menu>
      </el-aside>
      <el-container>
        <el-main>
          <div class="x-bar">
            <div :id="id" :option="option"></div>
          </div>
        </el-main>
<!--        <el-footer>-->

<!--        </el-footer>-->
      </el-container>
    </el-container>
  </el-container>
</template>
<script>
import { mapMutations } from 'vuex';
import Vuex from 'vuex' //引入 Vuex
import store from '../store'
import HighCharts from 'highcharts'
export default {
name: "YunMonitorServerv",
data() {
return {
userName: "",
activeIndex: '1',
arr: [],
chartData: [],
username: this.$route.query.data,
idForm: {
id: "1"
},
id: 'testtt',
option: {
chart: {
zoomType: 'x'
},
title: {
text: 'cpu.0.percent.active'//表头文字
},
subtitle: {
text: document.ontouchstart === undefined ?
'鼠标拖动可以进行缩放' : '手势操作进行缩放'
},
xAxis: {
type: 'datetime',
dateTimeLabelFormats: {
millisecond: '%H:%M:%S.%L',
second: '%H:%M:%S',
minute: '%H:%M',
hour: '%H:%M',
day: '%m-%d',
week: '%m-%d',
month: '%Y-%m',
year: '%Y'
}
},
tooltip: {
dateTimeLabelFormats: {
millisecond: '%H:%M:%S.%L',
second: '%H:%M:%S',
minute: '%H:%M',
hour: '%H:%M',
day: '%Y-%m-%d',
week: '%m-%d',
month: '%Y-%m',
year: '%Y'
}
},
yAxis: {
title: {
text: '使用率'
}
},
legend: {
enabled: false
},
plotOptions: {
area: {
fillColor: {
linearGradient: {
x1: 0,
y1: 0,
x2: 0,
y2: 1
},
stops: [
[0, HighCharts.getOptions().colors[0]],
[1, HighCharts.Color(HighCharts.getOptions().colors[0]).setOpacity(0).get('rgba')]
]
},
marker: {
radius: 2
},
lineWidth: 1,
states: {
hover: {
lineWidth: 1
}
},
threshold: null
}
},
series: [{
type: 'area',
name: '使用率',
data: [
]
}]
}
}
},
created() {
},
mounted() {
this.showCharts();
},
methods: {
...mapMutations(['changeLogin']),
toLogout() {
localStorage.removeItem('Authorization');
localStorage.removeItem('Username');
this.$router.push(
{
path: "/yun/login",
}
)
},
toLogin() {
this.$router.push(
{
path: "/yun/login",
}
)
},
showCharts() {
this.flag = true
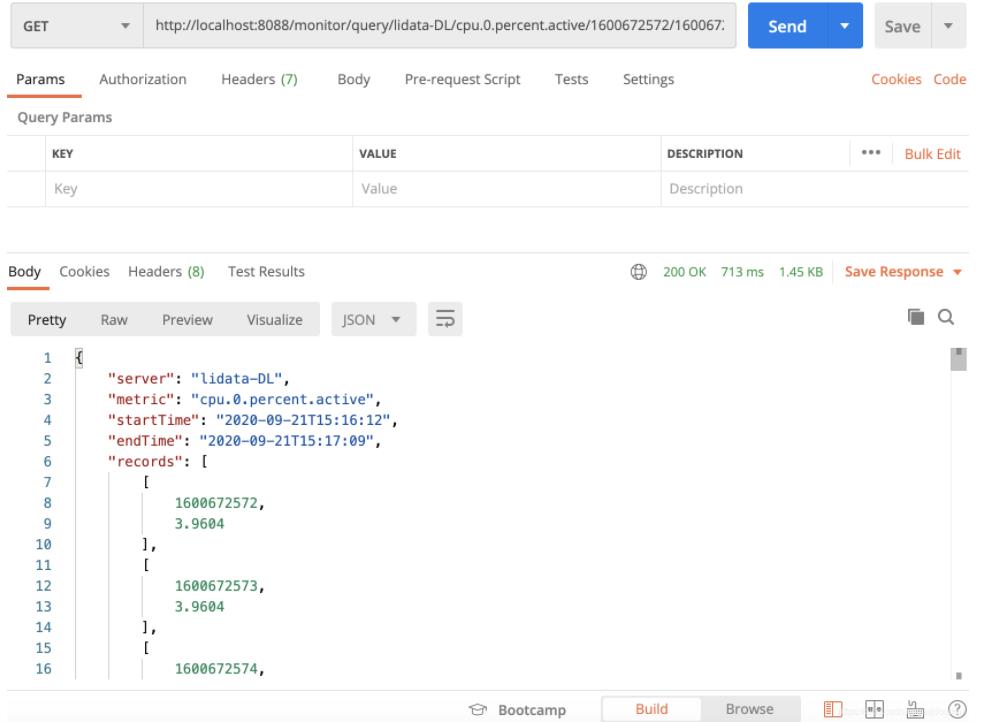
this.$http.get('http://localhost:8088/monitor/query/lidata-DL/cpu.0.percent.active/1600672572/1600672629',{
_timeout:5000,
onTimeout :(request) => {
this.$message.error('请求超时');
this.loading = false
}
}).then((response) => {
var res = JSON.parse(response.bodyText);
this.loading = false;
this.records = res.records;
var arr = res.records;
for(var i = 0;i < arr.length;i++){
this.chartData.push(arr[i]);
}
var oSeries = {
type: 'area',
name: '功率',
data: this.chartData
};
HighCharts.chart(this.id,this.option).addSeries(oSeries);
})
},
toVmDetail(url){
window.open(url)
},
handleSelect(key, keyPath) {
console.log(key, keyPath);
},
handleOpen(key, keyPath) {
console.log(key, keyPath);
},
handleClose(key, keyPath) {
console.log(key, keyPath);
},
}
}
</script>原本要求的数据格式是二维数组
series: [{
    type: 'area',
    name: 'area',
    data: [
        [1370131200000, 0.7695],
        [1370217600000, 0.7648]
    ]
}]
然后get请求的数据返回的时候直接返回二维数组就行了
需要注意的就是二维数组的更新方式
有的时候,当我们手动对data中的数据修改时,vue却监听不到这些数据的变化,导致页面没有触发新一轮的更新。
注意:出现以上问题的原因在于,没有通过vue提供的方法对保存在data中的数据进行修改。强制性通过js对数据修改的那些方法,有一部分在vue中是不被认可的。
对于数组的更新,一种可以使用
另一种则可以通过set方法()
this.set 这是vue实例调用 set 这是vue实例调用set这是vue实例调用set()方法,专门用来修改数组的
第一个参数,已经存在data中的数据,要被修改的数组
第二个参数,要修改的数组下标
第三个参数,要修改的数组对应下标的值
this.$set (this.selectedarr, index, option)

