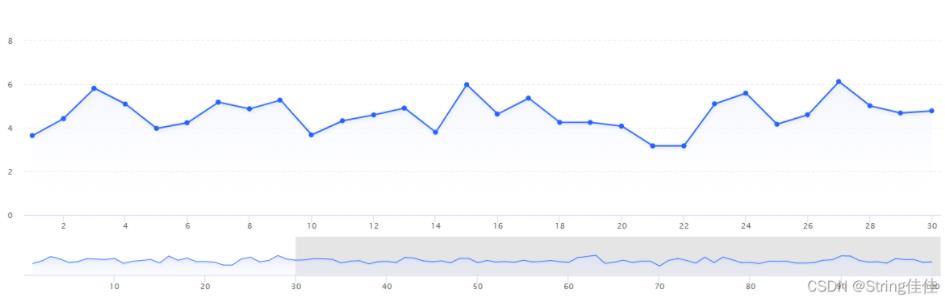
效果图:
实现方法(数据可自行修改):
<div id="container" style="width: 100%;height:370px;position: relative">
  <div id="detailContainer" ref="chart1" style="width:100%;height:370px" />
  <div id="masterContainer" ref="chart2" style="position: absolute;top: 270px;height: 100px;width: 100%" />
</div>
import Highcharts from 'highcharts'//eslint-disable-line
import $ from 'jquery'
var detailChart //eslint-disable-line
var masterChart //eslint-disable-line

export default {
  name: 'CollectDataCharts',
  data() {
    return {
      detailChartData: [//eslint-disable-line
        0.8446, 0.8445, 0.8444, 0.8451, 0.8418, 0.8264, 0.8258, 0.8232, 0.8233, 0.8258,
        0.8283, 0.8278, 0.8256, 0.8292, 0.8239, 0.8239, 0.8245, 0.8265, 0.8261, 0.8269,
        0.8273, 0.8244, 0.8244, 0.8172, 0.8139, 0.8146, 0.8164, 0.82, 0.8269, 0.8269,
        0.8269, 0.8258, 0.8247, 1.8286, 0.8289, 0.8316, 0.832, 0.8333, 0.8352, 0.8357,
        0.8355, 0.8354, 0.8403, 0.8403, 0.8406, 0.8403, 0.8396, 0.8418, 0.8409, 0.8384,
        0.8386, 0.8372, 0.839, 0.84, 0.8389, 0.84, 0.8423, 0.8423, 0.8435, 0.8422,
        0.838, 0.8373, 0.8316, 0.8303, 0.8303, 0.8302, 0.8369, 0.84, 0.8385, 0.84,
        0.8401, 0.8402, 0.8381, 0.8351, 0.8314, 0.8273, 0.8213, 0.8207, 0.8207, 0.8215,
        0.8242, 0.8273, 0.8301, 0.8346, 0.8312, 0.8312, 0.8312, 0.8306, 0.8327, 0.8282,
        0.824, 0.8255, 0.8256, 0.8273, 0.8209, 1.8151, 0.8149, 0.8213, 0.8273, 0.8273, // 100
        0.8261, 0.8252, 0.824, 0.8262, 0.8258, 0.8261, 0.826, 0.8199, 0.8153, 0.8097,
        0.8101, 0.8119, 0.8107, 0.8105, 0.8084, 0.8069, 0.8047, 0.8023, 0.7965, 0.7919,
        0.7921, 0.7922, 0.7934, 0.7918, 0.7915, 0.787, 0.7861, 0.7861, 0.7853, 0.7867,
        0.7827, 0.7834, 0.7766, 0.7751, 0.7739, 0.7767, 0.7802, 0.7788, 0.7828, 0.7816,
        0.7829, 0.783, 0.7829, 0.7781, 0.7811, 0.7831, 0.7826, 0.7855, 0.7855, 0.7845,
        0.7798, 0.7777, 0.7822, 0.7785, 0.7744, 0.7743, 0.7726, 0.7766, 0.7806, 0.785,
        0.7907, 0.7912, 1.7913, 0.7931, 0.7952, 0.7951, 0.7928, 0.791, 0.7913, 0.7912,
        0.7941, 0.7953, 0.7921, 0.7919, 0.7968, 0.7999, 0.7999, 0.7974, 0.7942, 0.796,
        0.7969, 0.7862, 0.7821, 0.7821, 0.7821, 0.7811, 0.7833, 0.7849, 0.7819, 0.7809,
        0.7809, 0.7827, 0.7848, 0.785, 0.7873, 0.7894, 0.7907, 0.7909, 0.7947, 0.7987, // 200
        0.799, 0.7927, 0.79, 0.7878, 0.7878, 0.7907, 0.7922, 0.7937, 0.786, 0.787,
        0.7838, 0.7838, 0.7837, 0.7836, 0.7806, 0.7825, 0.7798, 0.777, 0.777, 0.7772,
        0.7793, 0.7788, 0.7785, 0.7832, 0.7865, 0.7865, 0.7853, 0.7847, 0.7809, 0.778,
        0.7799, 0.78, 0.7801, 0.7765, 0.7785, 0.7811, 0.782, 0.7835, 0.7845, 0.7844,
        0.782, 0.7811, 0.7795, 0.7794, 0.7806, 0.7794, 0.7794, 0.7778, 0.7793, 0.7808,
        0.7824, 0.787, 0.7894, 0.7893, 0.7882, 1.7871, 0.7882, 0.7871, 0.7878, 0.79,
        0.7901, 0.7898, 0.7879, 0.7886, 0.7858, 0.7814, 0.7825, 0.7826, 0.7826, 0.786,
        0.7878, 0.7868, 0.7883, 0.7893, 0.7892, 0.7876, 0.785, 0.787, 0.7873, 0.7901,
        0.7936, 0.7939, 0.7938, 0.7956, 0.7975, 0.7978, 0.7972, 0.7995, 0.7995, 0.7994,
        0.7976, 0.7977, 0.796, 0.7922, 0.7928, 0.7929, 0.7948, 0.797, 0.7953, 0.7907 // 300
      ]
    }
  },
  mounted() {
    $(window).resize(() => {
      detailChart.reflow()
      masterChart.reflow()
    })
  },
  beforeDestroy() {
    $(window).off('resize')
  },
  methods: {
    createDetail(masterChart) {
      var detailData = []
      Highcharts.each(masterChart.series[0].data, (d, index) => {
        if (d.x < 30) {
          detailData.push({
            x: d.x,
            y: d.y,
            time: d.time
          })
        }
      })
      detailChart = Highcharts.chart('detailContainer', {
        chart: {
          type: 'area', // areaspline
          marginBottom: 120,
          reflow: false,
          marginLeft: 50,
          marginRight: 20,
          style: {
            position: 'absolute'
          }
        },
        credits: {
          enabled: false
        },
        title: {
          text: ''
        },
        subtitle: {
          text: ''
        },
        xAxis: {
          // type: 'datetime'
        },
        yAxis: {
          gridLineDashStyle: 'dash',
          title: {
            text: null
          },
          maxZoom: 0.1
        },
        tooltip: {
          formatter: function() {
            var point = this.points[0]
            const date = new Date(point.point.time)
            const y = date.getFullYear()
            let MM = date.getMonth() + 1
            MM = MM < 10 ? ('0' + MM) : MM
            let d = date.getDate()
            d = d < 10 ? ('0' + d) : d
            let h = date.getHours()
            h = h < 10 ? ('0' + h) : h
            let m = date.getMinutes()
            m = m < 10 ? ('0' + m) : m
            let s = date.getSeconds()
            s = s < 10 ? ('0' + s) : s
            const time = y + '-' + MM + '-' + d + ' ' + h + ':' + m + ':' + s
            return '<span>' + time + '</span><br/>' +
                '<b>' + point.series.name + ':' + point.y + ' mm/s</b>'
          },
          shared: true
        },
        legend: {
          enabled: false
        },
        plotOptions: {
          series: {
            shadow: {
              color: '#e1e8fe',
              width: 6,
              offsetY: 3
            },
            marker: {
              enabled: true,
              radius: 3.5,
              states: {
                hover: {
                  enabled: true,
                  radius: 3
                }
              }
            },
            fillColor: {// 注意!!!如果是柱状图请使用color,如果是面积图请使用fillColor
              linearGradient: {
                x1: 0,
                y1: 0,
                x2: 0,
                y2: 1
              },
              stops: [
                [0, '#f3f6ff'],
                [1, Highcharts.Color('white').setOpacity(0).get('rgba')]
              ]
            }
          }
        },
        series: [{
          name: '总体振动',
          animation: false,
          color: '#225FFB',
          data: detailData
        }]
      })
    },
    createMaster() {
      let detailData = []//eslint-disable-line
      Highcharts.each(this.detailChartData, (d, index) => {
        if (d) {
          detailData.push({
            x: Number(index) + 1,
            y: Number(d),
            time: 1639538317248
          })
        }
      })
      masterChart = Highcharts.chart('masterContainer', {
        chart: {
          type: 'spline',
          reflow: false,
          borderWidth: 0,
          backgroundColor: null,
          marginLeft: 50,
          marginRight: 20,
          zoomType: 'x',
          events: {
            // listen to the selection event on the master chart to update the
            // extremes of the detail chart
            selection: function(event) {
              var extremesObject = event.xAxis[0]
              var min = extremesObject.min
              var max = extremesObject.max
              var detailData = []
              var xAxis = this.xAxis[0]
              Highcharts.each(this.series[0].data, (d, index) => {
                if (d.x > min && d.x < max) {
                  detailData.push({
                    x: d.x,
                    y: d.y,
                    time: d.time
                  })
                }
              })
              xAxis.removePlotBand('mask-before')
              xAxis.addPlotBand({
                id: 'mask-before',
                from: 1,
                to: min,
                color: 'rgba(0, 0, 0, 0.1)'
              })
              xAxis.removePlotBand('mask-after')
              xAxis.addPlotBand({
                id: 'mask-after',
                from: max,
                to: 300,
                color: 'rgba(0, 0, 0, 0.1)'
              })
              detailChart.series[0].setData(detailData)
              return false
            }
          }
        },
        title: {
          text: null
        },
        xAxis: {
          plotBands: [{
            id: 'mask-before',
            from: 30,
            to: 300,
            color: 'rgba(0, 0, 0, 0.1)'
          }],
          title: {
            text: null
          }
        },
        yAxis: {
          gridLineWidth: 0,
          labels: {
            enabled: false
          },
          title: {
            text: null
          },
          min: 0.6,
          showFirstLabel: false
        },
        tooltip: {
          formatter: () => {
            return false
          }
        },
        legend: {
          enabled: false
        },
        credits: {
          enabled: false
        },
        plotOptions: {
          series: {
            fillColor: {
              linearGradient: [0, 0, 0, 70],
              stops: [
                [0, '#c3cffe'],
                [1, 'rgba(255,255,255,0)']
              ]
            },
            lineWidth: 1,
            marker: {
              enabled: false
            },
            shadow: false,
            states: {
              hover: {
                lineWidth: 1
              }
            },
            enableMouseTracking: false
          }
        },
        series: [{
          type: 'area',
          name: 'USD to EUR',
          pointInterval: 100,
          pointStart: 1,
          animation: false,
          color: '#225FFB',
          data: detailData
        }],
        exporting: {
          enabled: false
        }
      }, (masterChart) => {
        this.createDetail(masterChart)
      })
      return masterChart
    }
  }
}

