用法:
matplotlib.pyplot.stem(*args, linefmt=None, markerfmt=None, basefmt=None, bottom=0, label=None, use_line_collection=True, orientation='vertical', data=None)
参数说明
| 参数 | |
|---|---|
| *args | x,y,x—棉棒的x轴基线的取值范围,y—棉棒的长度 |
| linefmt | 棉棒的样式,{‘-’,’–’,’:’,’-.’},包括指定颜色等 |
| markerfmt | 棉棒末端的样式 |
| basefmt | 指定基线的样式 |
| bottom | 默认值为0,极限的y/x的位置,取决于方向 |
| label | 用于标签 |
| use_line_collection | 默认值是True,如果为True,棉棒的茎线存储并绘制为线集合,而不是单独的线,这将显著提高性能,而不是单独的线 |
| orientation | 控制方向,默认为垂直(True). |
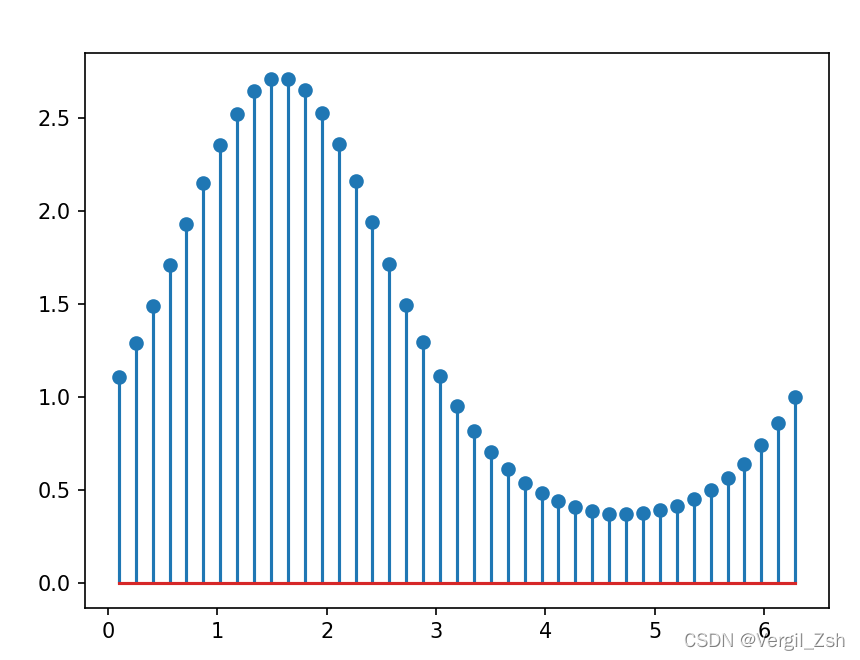
x,y
import matplotlib.pyplot as plt
import numpy as np
x = np.linspace(0.1, 2 * np.pi, 41)
y = np.exp(np.sin(x))
plt.stem(x, y)
plt.show()
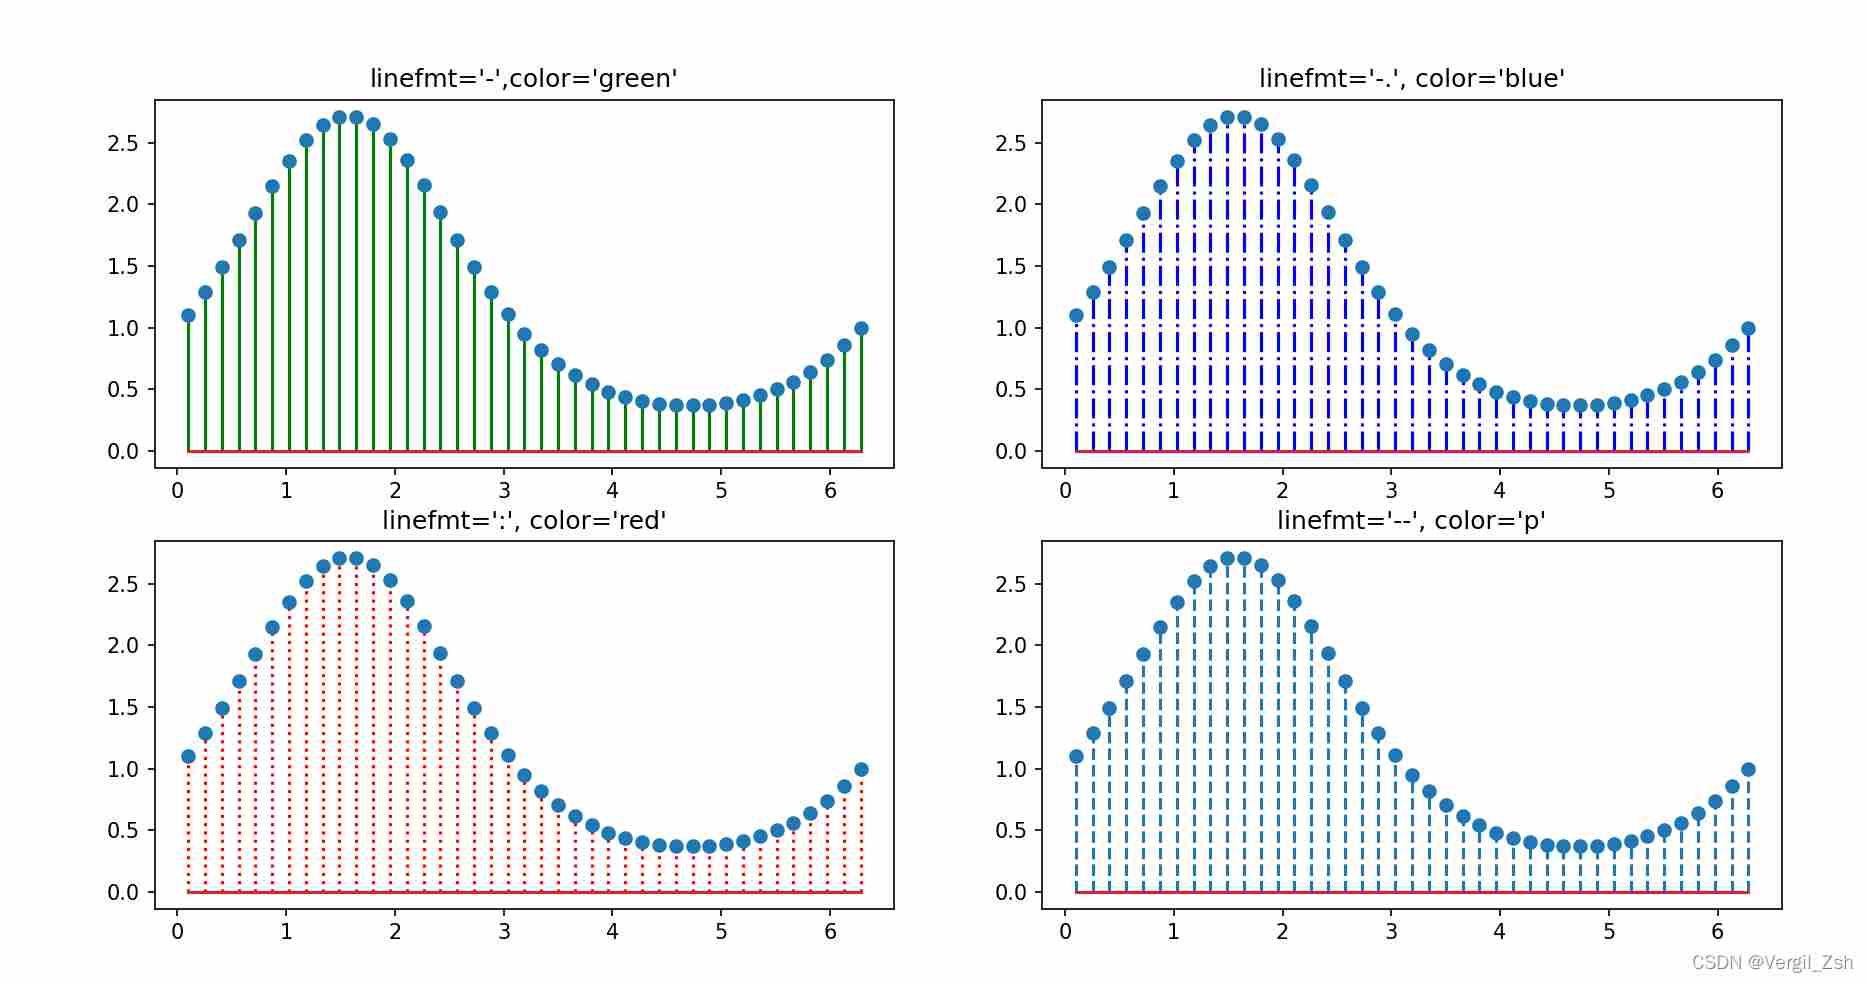
linefmtlinefmt用来指定棉棒的颜色和样式等
import numpy as np
import matplotlib.pyplot as plt

x = np.linspace(0.1,2 * np.pi, 41)
y = np.exp(np.sin(x))
fit, axs = plt.subplots(nrows=2, ncols=2, figsize=(14,7))
axs[0,0].set_title("linefmt='-',color='green'")
axs[0,0] = axs[0,0].stem(x,y,linefmt='g-')
axs[0,1].set_title("linefmt='-.', color='blue'")
axs[0,1] = axs[0,1].stem(x,y,linefmt='b-.')
axs[1,0].set_title("linefmt=':', color='red'")
axs[1,0] = axs[1,0].stem(x,y,linefmt='r:')
axs[1,1].set_title("linefmt='--', color='p'")
axs[1,1] = axs[1,1].stem(x,y,linefmt='o--')
plt.show()
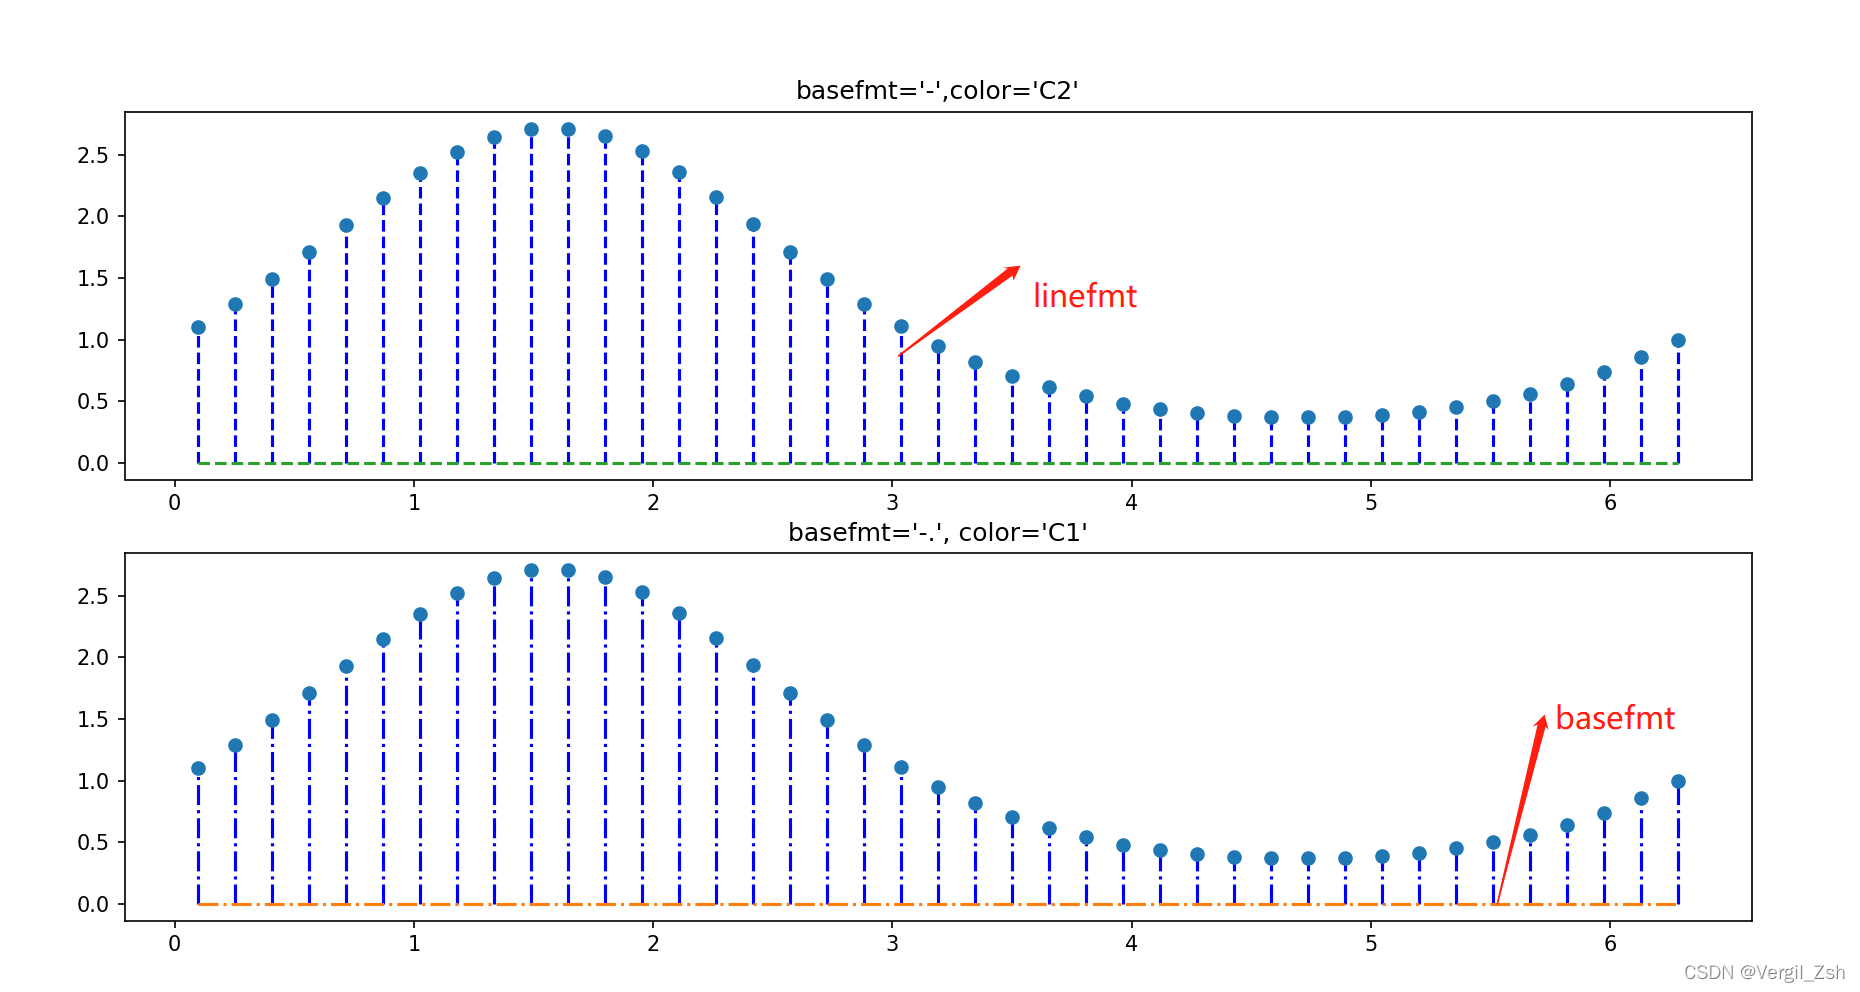
basefmt
import numpy as np
import matplotlib.pyplot as plt

x = np.linspace(0.1,2 * np.pi, 41)
y = np.exp(np.sin(x))
fit, axs = plt.subplots(nrows=2, ncols=1, figsize=(14,7))
axs[0].set_title("basefmt='-',color='C2'")
axs[0] = axs[0].stem(x,y,linefmt='b--',basefmt='C2--')
axs[1].set_title("basefmt='-.', color='C1'")
axs[1] = axs[1].stem(x,y,linefmt='b-.',basefmt='C1-.')
plt.show()
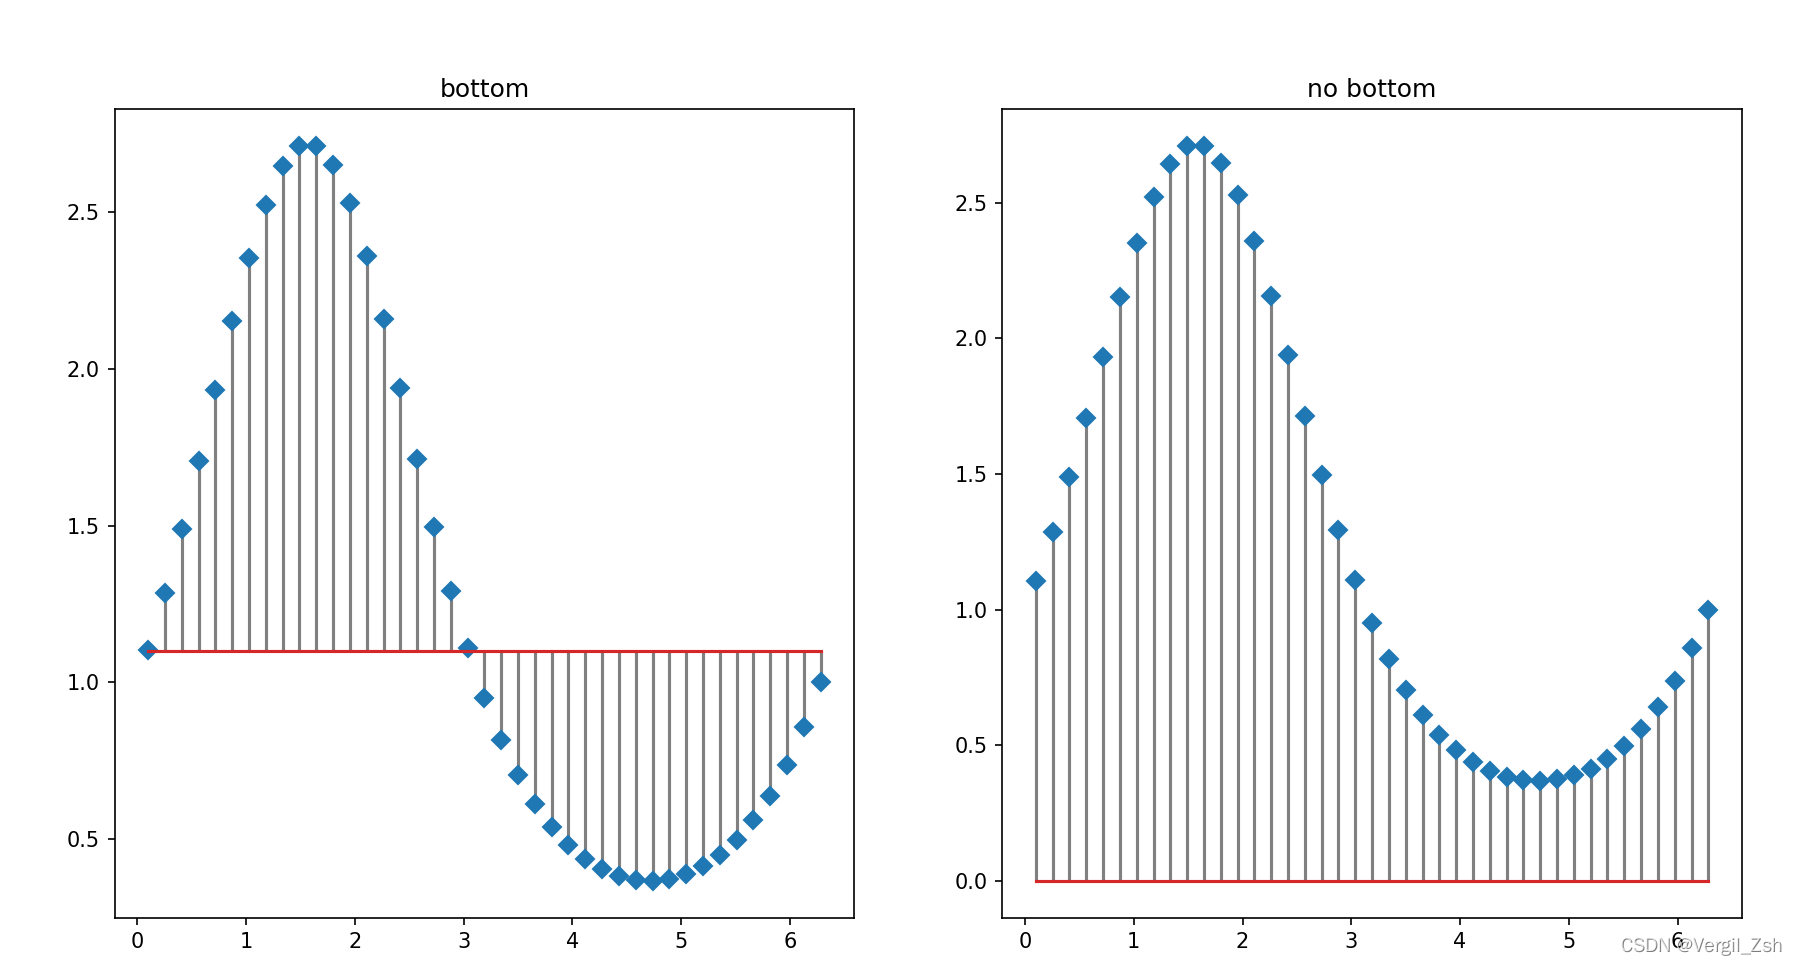
bottom
import numpy as np
import matplotlib.pyplot as plt

x = np.linspace(0.1,2 * np.pi, 41)
y = np.exp(np.sin(x))
fit, axs = plt.subplots(nrows=1, ncols=2, figsize=(14,7))
axs[0].set_title("bottom")
axs[0].stem(x,y,linefmt='grey',markerfmt='D',bottom=1.1)
axs[1].set_title('no bottom')
axs[1].stem(x,y,linefmt='grey',markerfmt='D')
plt.show()
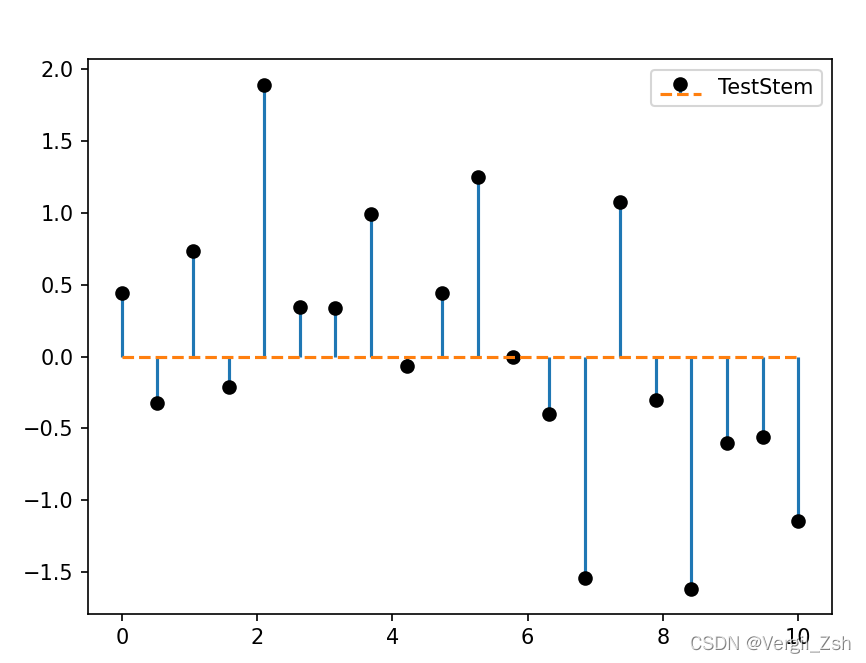
案例
import numpy as np
import matplotlib.pyplot as plt
# 生成模拟数据集
x=np.linspace(0,10,20)
y=np.random.randn(20)
# 绘制棉棒图
markerline, stemlines, baseline = plt.stem(x,y,linefmt='-',markerfmt='o',basefmt='--',label='TestStem')
# 可单独设置棉棒末端,棉棒连线以及基线的属性
plt.setp(markerline, color='k')#将棉棒末端设置为黑色
plt.legend()
plt.show()
本篇文章就到这里了,希望能够给你带来帮助,也希望您能够多多关注的更多内容!

