import matplotlib.pyplot as plt
import numpy as np

fig = plt.figure()
def call_back(event):
    axtemp=event.inaxes
    x_min, x_max = axtemp.get_xlim()
    fanwei = (x_max - x_min) / 10
    if event.button == 'up':
        axtemp.set(xlim=(x_min + fanwei, x_max - fanwei))
        print('up')
    elif event.button == 'down':
        axtemp.set(xlim=(x_min - fanwei, x_max + fanwei))
        print('down')
    fig.canvas.draw_idle()  # 绘图动作实时反映在图像上
fig.canvas.mpl_connect('scroll_event', call_back)
fig.canvas.mpl_connect('button_press_event', call_back)

ax1 = plt.subplot(3,1,1)#截取幕布的一部分
ax1.xaxis.set_major_formatter(plt.NullFormatter())  # 取消x轴坐标
x = np.linspace(-5, 5, 10)
y = x ** 2 + 1
plt.ylabel('first')
plt.plot(x, y)
plt.grid()
ax2 = plt.subplot(3,1,2)
ax2.xaxis.set_major_formatter(plt.NullFormatter())  # 取消x轴坐标
y1=-x**2+1
plt.plot(x, y1)

ax3 = plt.subplot(3,1,3)
y3=-x*2+1
plt.plot(x, y3)

plt.show()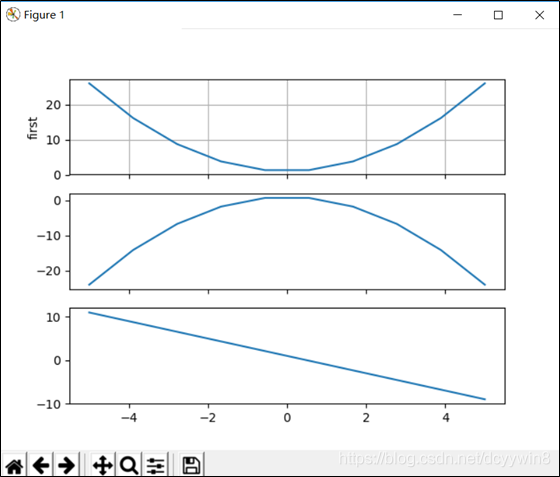
PS:在相应坐标系内滚动鼠标滚轮即可放大/缩小x轴。

