本次内容主要是上周内容的延续,主要画出kitti车的行驶的轨迹
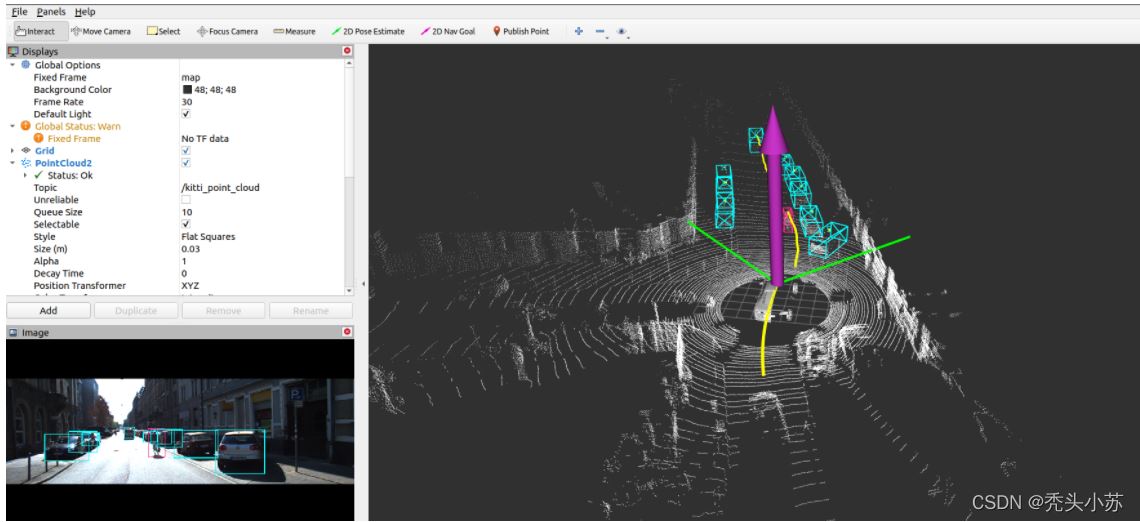
同样的,我们先来看看最终实现的效果:
接下来就进入一步步的编码环节。。。
计算移动距离
#定义计算GPS距离方法
def computer_great_circle_distance(lat1,lon1,lat2,lon2):
    delta_sigma = float(np.sin(lat1*np.pi/180)*np.sin(lat2*np.pi/180)+\
                        np.cos(lat1*np.pi/180)*np.cos(lat2*np.pi/180)*np.cos(lon1*np.pi/180-lon2*np.pi/180))
    return 6371000.0*np.arccos(np.clip(delta_sigma,-1,1))

#使用GPS计算距离
gps_distance += [computer_great_circle_distance(imu_data.lat,imu_data.lon,prev_imu_data.lat,prev_imu_data.lon)]IMU_COLUMN_NAMES = ['lat','lon','alt','roll','pitch','yaw','vn','ve','vf','vl','vu','ax','ay','az','af',
'al','au','wx','wy','wz','wf','wl','wu','posacc','velacc','navstat','numsats','posmode',
'velmode','orimode']
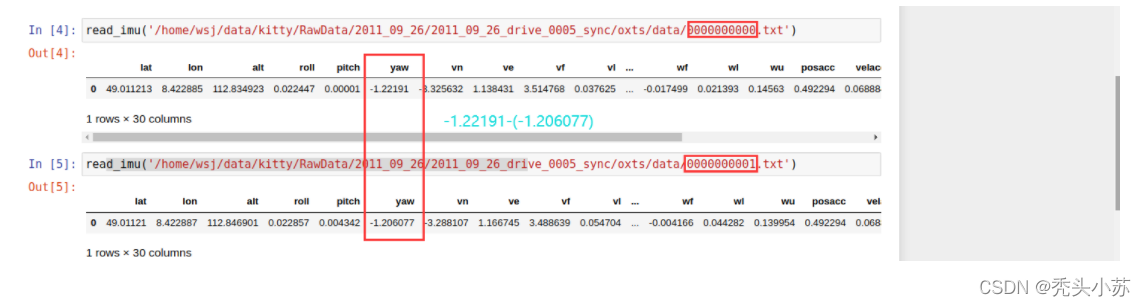
#获取IMU数据
imu_data = read_imu('/home/wsj/data/kitty/RawData/2011_09_26/2011_09_26_drive_0005_sync/oxts/data/%010d.txt'%frame)
#使用IMU计算距离
imu_distance += [0.1*np.linalg.norm(imu_data[['vf','vl']])]import matplotlib.pyplot as plt plt.figure(figsize=(20,10)) plt.plot(gps_distance, label='gps_distance') plt.plot(imu_distance, label='imu_distance') plt.legend() plt.show()
![[外链图片转存失败,源站可能有防盗链机制,建议将图片保存下来直接上传(img-CWY7VHDj-1640154002451)(C:\Users\WSJ\AppData\Roaming\Typora\typora-user-images\image-20211221163928106.png)]](https://img.qb5200.com/20220618/4d61125a5a10d8c21caef4bb497b01ee.png)
显然,IMU计算的距离较为平滑。
prev_imu_data = None
locations = []
for frame in range(150):
    imu_data = read_imu('/home/wsj/data/kitty/RawData/2011_09_26/2011_09_26_drive_0005_sync/oxts/data/%010d.txt'%frame)

    if prev_imu_data is not None:
        displacement = 0.1*np.linalg.norm(imu_data[['vf','vl']])
        yaw_change = float(imu_data.yaw-prev_imu_data.yaw)
        for i in range(len(locations)):
            x0, y0 = locations[i]
            x1 = x0 * np.cos(yaw_change) + y0 * np.sin(yaw_change) - displacement
            y1 = -x0 * np.sin(yaw_change) + y0 * np.cos(yaw_change)
            locations[i] = np.array([x1,y1])

    locations += [np.array([0,0])]
    prev_imu_data =imu_data
plt.figure(figsize=(20,10))
plt.plot(np.array(locations)[:, 0],np.array(locations)[:, 1])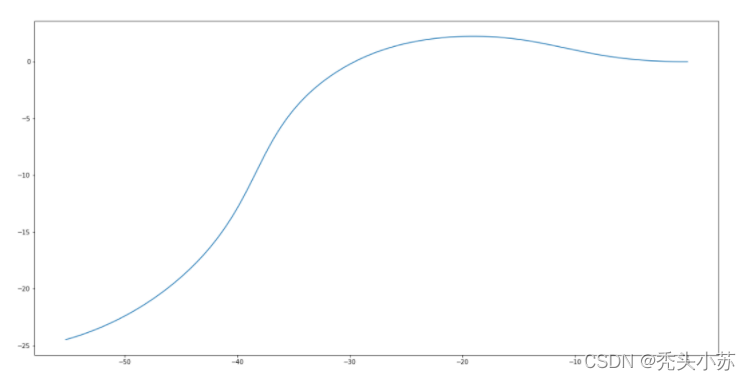
class Object():
    def __init__(self, center):
        self.locations = deque(maxlen=20)
        self.locations.appendleft(center)
    def update(self, center, displacement, yaw):
        for i in range(len(self.locations)):
            x0, y0 = self.locations[i]
            x1 = x0 * np.cos(yaw_change) + y0 * np.sin(yaw_change) - displacement
            y1 = -x0 * np.sin(yaw_change) + y0 * np.cos(yaw_change)
            self.locations[i] = np.array([x1,y1])
        if center is not None:
            self.locations.appendleft(center)
    def reset(self):
        self.locations = deque(maxlen=20)
#创建发布者
loc_pub = rospy.Publisher('kitti_loc', MarkerArray, queue_size=10)

  #获取距离和旋转角度
        imu_data =  read_imu('/home/wsj/data/kitty/RawData/2011_09_26/2011_09_26_drive_0005_sync/oxts/data/%010d.txt'%frame)

        if prev_imu_data is None:
            for track_id in centers:
                tracker[track_id] = Object(centers[track_id])
        else:
            displacement = 0.1*np.linalg.norm(imu_data[['vf','vl']])
            yaw_change = float(imu_data.yaw - prev_imu_data.yaw)
            for track_id in centers: # for one frame id
                if track_id in tracker:
                    tracker[track_id].update(centers[track_id], displacement, yaw_change)
                else:
                    tracker[track_id] = Object(centers[track_id])
            for track_id in tracker:# for whole ids tracked by prev frame,but current frame did not
                if track_id not in centers: # dont know its center pos
                    tracker[track_id].update(None, displacement, yaw_change)

        prev_imu_data = imu_data

def publish_loc(loc_pub, tracker, centers):
    marker_array = MarkerArray()
    for track_id in centers:
        marker = Marker()
        marker.header.frame_id = FRAME_ID
        marker.header.stamp = rospy.Time.now()

        marker.action = marker.ADD
        marker.lifetime = rospy.Duration(LIFETIME)
        marker.type = Marker.LINE_STRIP
        marker.id = track_id
        marker.color.r = 1.0
        marker.color.g = 1.0
        marker.color.b = 0.0
        marker.color.a = 1.0
        marker.scale.x = 0.2

        marker.points = []
        for p in tracker[track_id].locations:
            marker.points.append(Point(p[0], p[1], 0))
        marker_array.markers.append(marker)
    loc_pub.publish(marker_array)