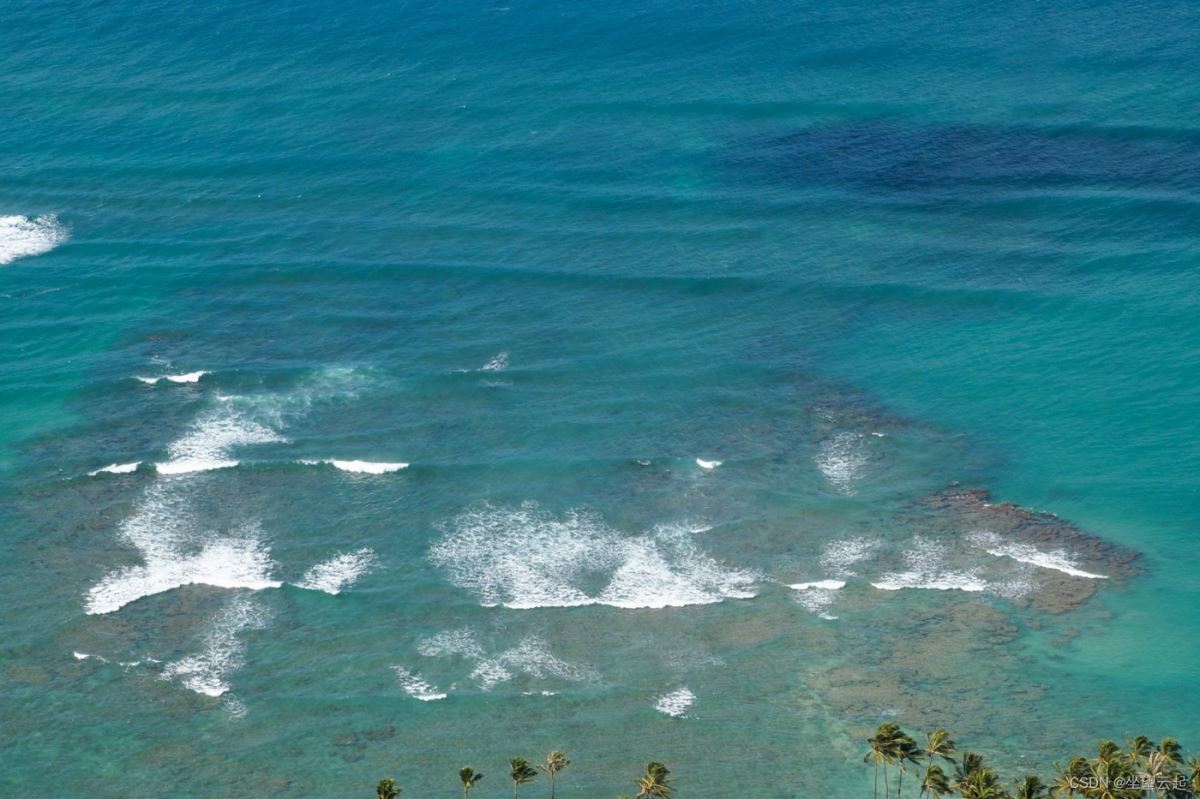
从选择图像开始。 例如,我将使用下面的海水和椰子树的照片。
接下来,让我们导入 extcolors 和 rgb2hex 库。 extcolors 库返回 RGB 值,将使用 rgb2hex 库将其转换为 HEX 颜色代码。
import numpy as np
import pandas as pd
import matplotlib.pyplot as plt
import matplotlib.patches as patches
import matplotlib.image as mpimg

from PIL import Image
from matplotlib.offsetbox import OffsetImage, AnnotationBbox
如果在导入这两个库时出现一些错误,您可以尝试安装一些必备库以使其工作。 这些库在下面的代码中。 删除 !pip 前面的 # 符号并运行以安装它们。 请不要删除版本号前的#符号。 它们只是笔记。
#!pip install easydev                 #version 0.12.0
#!pip install colormap                #version 1.0.4
#!pip install opencv-python           #version 4.5.5.64
#!pip install colorgram.py            #version 1.2.0
#!pip install extcolors               #version 1.0.0
import cv2
import extcolors
from colormap import rgb2hex
接下来,我将逐步解释如何创建用于颜色提取的函数。 如果你想直接得到函数,请给定义一个函数打分。
调整图像大小
从准备输入图像开始。 用现代相机和手机拍摄的照片太大了。 有些人可以拍摄超过 50 兆像素的照片(4K 显示器只能显示大约 8.3 兆像素)。 如果我们直接使用一个巨大的图像,处理可能需要一些时间。
因此,首先要做的是调整大小。 下面的代码显示了如何将图片的大小调整为 900 像素的宽度。 如果图像不是很大或者你的 CPU 速度很快,这一步可以省略,或者可以增加输出分辨率数。 请注意,调整照片大小后,新照片将保存在您的计算机上以供下一步阅读。
input_name = '<photo location/name>'
output_width = 900                   #set the output size
img = Image.open(input_name)
wpercent = (output_width/float(img.size[0]))
hsize = int((float(img.size[1])*float(wpercent)))
img = img.resize((output_width,hsize), Image.ANTIALIAS)

#save
resize_name = 'resize_' + input_name  #the resized image name
img.save(resize_name)                 #output location can be specified before resize_name

#read
plt.figure(figsize=(9, 9))
img_url = resize_name
img = plt.imread(img_url)
plt.imshow(img)
plt.axis('off')
plt.show()
颜色提取
使用 extcolors 库提取颜色。 我们必须设置的参数:
容差:对颜色进行分组以限制输出并提供更好的视觉表示。 基于从 0 到 100 的比例。其中 0 不会对任何颜色进行分组,而 100 会将所有颜色归为一个。
限制:输出中呈现的提取颜色数量的上限。
在下面的代码中,我将公差值设置为 12,并将颜色代码输出的数量限制为 11 种颜色(limit=12)。 可以根据需要更改数字。 获得的结果将是 RGB 颜色代码及其出现。
colors_x = extcolors.extract_from_path(img_url, tolerance = 12, limit = 12)
colors_x
使用 rgb2hex 库定义一个函数以将 RGB 代码转换为 HEX 颜色代码并创建一个 DataFrame。
def color_to_df(input):
    colors_pre_list = str(input).replace('([(','').split(', (')[0:-1]
    df_rgb = [i.split('), ')[0] + ')' for i in colors_pre_list]
    df_percent = [i.split('), ')[1].replace(')','') for i in colors_pre_list]

    #convert RGB to HEX code
    df_color_up = [rgb2hex(int(i.split(", ")[0].replace("(","")),
                          int(i.split(", ")[1]),
                          int(i.split(", ")[2].replace(")",""))) for i in df_rgb]

    df = pd.DataFrame(zip(df_color_up, df_percent), columns = ['c_code','occurence'])
    return df

df_color = color_to_df(colors_x)
df_color
绘制图标
list_color = list(df_color['c_code'])
list_precent = [int(i) for i in list(df_color['occurence'])]
text_c = [c + ' ' + str(round(p*100/sum(list_precent),1)) +'%' for c, p in zip(list_color,
                                                                               list_precent)]
fig, ax = plt.subplots(figsize=(90,90),dpi=10)
wedges, text = ax.pie(list_precent,
                      labels= text_c,
                      labeldistance= 1.05,
                      colors = list_color,
                      textprops={'fontsize': 120, 'color':'black'}
                     )
plt.setp(wedges, width=0.3)

#create space in the center
plt.setp(wedges, width=0.36)

ax.set_aspect("equal")
fig.set_facecolor('white')
plt.show()
#create background color
fig, ax = plt.subplots(figsize=(192,108),dpi=10)
fig.set_facecolor('white')
plt.savefig('bg.png')
plt.close(fig)

#create color palette
bg = plt.imread('bg.png')
fig = plt.figure(figsize=(90, 90), dpi = 10)
ax = fig.add_subplot(1,1,1)

x_posi, y_posi, y_posi2 = 320, 25, 25
for c in list_color:
    if  list_color.index(c) <= 5:
        y_posi += 125
        rect = patches.Rectangle((x_posi, y_posi), 290, 115, facecolor = c)
        ax.add_patch(rect)
        ax.text(x = x_posi+360, y = y_posi+80, s = c, fontdict={'fontsize': 150})
    else:
        y_posi2 += 125
        rect = patches.Rectangle((x_posi + 800, y_posi2), 290, 115, facecolor = c)
        ax.add_artist(rect)
        ax.text(x = x_posi+1160, y = y_posi2+80, s = c, fontdict={'fontsize': 150})

ax.axis('off')
plt.imshow(bg)
plt.tight_layout()
我为了省事,resize路径被写在程序了,请注意根据自己的情况修改。
import numpy as np
import pandas as pd
import matplotlib.pyplot as plt
import matplotlib.patches as patches
import matplotlib.image as mpimg

from PIL import Image
from matplotlib.offsetbox import OffsetImage, AnnotationBbox

import cv2
import extcolors

from colormap import rgb2hex

def color_to_df(input):
    colors_pre_list = str(input).replace('([(', '').split(', (')[0:-1]
    df_rgb = [i.split('), ')[0] + ')' for i in colors_pre_list]
    df_percent = [i.split('), ')[1].replace(')', '') for i in colors_pre_list]

    # convert RGB to HEX code
    df_color_up = [rgb2hex(int(i.split(", ")[0].replace("(", "")),
                           int(i.split(", ")[1]),
                           int(i.split(", ")[2].replace(")", ""))) for i in df_rgb]

    df = pd.DataFrame(zip(df_color_up, df_percent), columns=['c_code', 'occurence'])
    return df


def exact_color(input_image, resize, tolerance, zoom):
    # background
    bg = 'bg.png'
    fig, ax = plt.subplots(figsize=(192, 108), dpi=10)
    fig.set_facecolor('white')
    plt.savefig(bg)
    plt.close(fig)

    # resize
    output_width = resize
    img = Image.open(input_image)
    if img.size[0] >= resize:
        wpercent = (output_width / float(img.size[0]))
        hsize = int((float(img.size[1]) * float(wpercent)))
        img = img.resize((output_width, hsize), Image.ANTIALIAS)
        resize_name = 'C:/Users/zyh/Desktop/resize_456.jpg'
        img.save(resize_name)
    else:
        resize_name = input_image

    # crate dataframe
    img_url = resize_name
    colors_x = extcolors.extract_from_path(img_url, tolerance=tolerance, limit=13)
    df_color = color_to_df(colors_x)

    # annotate text
    list_color = list(df_color['c_code'])
    list_precent = [int(i) for i in list(df_color['occurence'])]
    text_c = [c + ' ' + str(round(p * 100 / sum(list_precent), 1)) + '%' for c, p in zip(list_color, list_precent)]
    fig, (ax1, ax2) = plt.subplots(1, 2, figsize=(160, 120), dpi=10)

    # donut plot
    wedges, text = ax1.pie(list_precent,
                           labels=text_c,
                           labeldistance=1.05,
                           colors=list_color,
                           textprops={'fontsize': 150, 'color': 'black'})
    plt.setp(wedges, width=0.3)

    # add image in the center of donut plot
    img = mpimg.imread(resize_name)
    imagebox = OffsetImage(img, zoom=zoom)
    ab = AnnotationBbox(imagebox, (0, 0))
    ax1.add_artist(ab)

    # color palette
    x_posi, y_posi, y_posi2 = 160, -170, -170
    for c in list_color:
        if list_color.index(c) <= 5:
            y_posi += 180
            rect = patches.Rectangle((x_posi, y_posi), 360, 160, facecolor=c)
            ax2.add_patch(rect)
            ax2.text(x=x_posi + 400, y=y_posi + 100, s=c, fontdict={'fontsize': 190})
        else:
            y_posi2 += 180
            rect = patches.Rectangle((x_posi + 1000, y_posi2), 360, 160, facecolor=c)
            ax2.add_artist(rect)
            ax2.text(x=x_posi + 1400, y=y_posi2 + 100, s=c, fontdict={'fontsize': 190})

    fig.set_facecolor('white')
    ax2.axis('off')
    bg = plt.imread('bg.png')
    plt.imshow(bg)
    plt.tight_layout()
    return plt.show()
exact_color('C:/Users/zyh/Desktop/456.jpg', 900, 12, 2.5)
运行结果如下


