
FuncAnimation,它的使用要求简洁且定制化程度较高。如果想将很多图片合并为一个动图,那么ArtistAnimation是最合适的选择。
通过反复调用同一函数来制作动画。
注意:创建FuncAnimation对象后一定要将其赋值给某个变量,否则系统会将其进行垃圾回收。
class matplotlib.animation.FuncAnimation(fig,
										func,
										frames=None,
										init_func=None,
										fargs=None,
										save_count=None, *,
										cache_frame_data=True,
										**kwargs)
参数:
示例:
import numpy as np
import matplotlib.pyplot as plt
from matplotlib.animation import FuncAnimation
fig = plt.figure()
ax = fig.subplots()

t=np.linspace(0,10,100)
y=np.sin(t)
ax.set_aspect(3)
ax.plot(t,y,'--',c='gray')
line=ax.plot(t,y,c='C2')

def update(i):  #帧更新函数
    global t    #直接引用全局变量,也可以通过函数的frames或fargs参数传递。
    t+=0.1
    y=np.sin(t)
    line[0].set_ydata(y)
    return line

ani=FuncAnimation(fig,update,interval=100) #绘制动画
plt.show() #显示动画
import numpy as np
import matplotlib.pyplot as plt
import matplotlib.animation as animation

fig = plt.figure(figsize=(7, 2), dpi=100)
ax = plt.subplot()
X = np.linspace(-np.pi, np.pi, 256, endpoint=True)
C, S = np.cos(X), np.sin(X)
line1, = ax.plot(X, C, marker="o", markevery=[-1], markeredgecolor="white")
line2, = ax.plot(X, S, marker="o", markevery=[-1], markeredgecolor="white")

def update(frame):
    line1.set_data(X[:frame], C[:frame])
    line2.set_data(X[:frame], S[:frame])

ani = animation.FuncAnimation(fig, update, interval=10)
plt.show()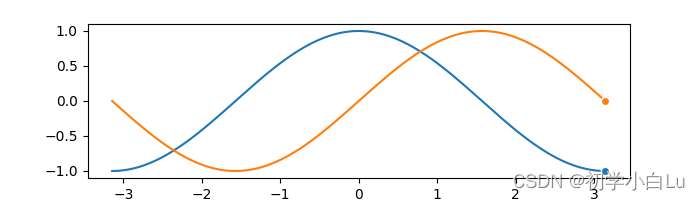
方法 init(fig, func[, frames, init_func, …])
通过调用一个固定的Artist对象来制作动画,例如给定的系列图片或者matplotlib的绘图对象.。
class matplotlib.animation.ArtistAnimation(fig, artists, *args, **kwargs)
参数:
示例:
import numpy as np
import matplotlib.pyplot as plt
from matplotlib.animation import ArtistAnimation
fig = plt.figure()
ax = fig.subplots()

arts=[]
t=np.linspace(0,np.pi*2,20)
for i in range(20):
    t+=np.pi*2/20
    y=np.sin(t)
    lines=ax.plot(y,'--',c='gray')  #绘制一帧图形
    arts.append(lines)              #每帧图形都保存到列表中

ani=ArtistAnimation(fig,arts,interval=200) #绘制动画
#ani.save("animate_artists_basic.gif")  #保存动画
plt.show() #显示动画
方法:
__init__(fig, artists, *args, **kwargs)
new_frame_seq()
new_saved_frame_seq()
pause()
resume()
save(filename[, writer, fps, dpi, codec, ...])
参数:
“pillow”:PillowWriter,用pillow库写如动画文件。
“ffmpeg”:FFMpegWriter,基于ffmpeg库写动画。
“ffmpeg_file”:FFMpegFileWriter,基于文件的FFMpegWriter,用ffmpeg库把帧写入临时文件,然后拼接成动画。
“imagemagick”:ImageMagickWriter,基于管道的动画GIF。帧通过管道传输到ImageMagick并写入文件。
“imagemagick_file”:基于文件的imagemagick写动画。
“hmtl”:HTMLWriter,基于javascript html的动画。
to_html5_video([embed_limit])
embed_limit:动画文件大小限制,单位为MB。默认为20MB,超出限制则不创建动画。 绘制平滑曲线
import numpy as np
import matplotlib.pyplot as plt

x = np.array([1, 2, 3, 4, 5, 6, 7])
y = np.array([100, 50, 25, 12.5, 6.25, 3.125, 1.5625])

plt.plot(x, y)
plt.title("Spline Curve")
plt.xlabel("X")
plt.ylabel("Y")
plt.show()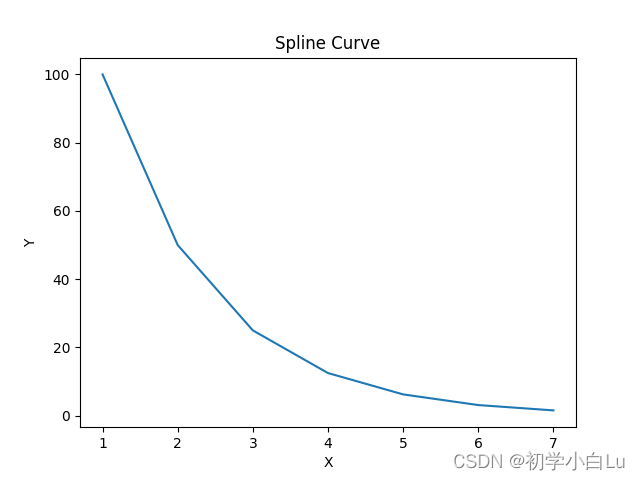
import numpy as np
import matplotlib.pyplot as plt
from scipy.ndimage import gaussian_filter1d

x=np.array([1,2,3,4,5,6,7])
y=np.array([100,50,25,12.5,6.25,3.125,1.5625])
y_smoothed = gaussian_filter1d(y, sigma=5)

plt.plot(x, y_smoothed)
plt.title("Spline Curve Using the Gaussian Smoothing")
plt.xlabel("X")
plt.ylabel("Y")
plt.show()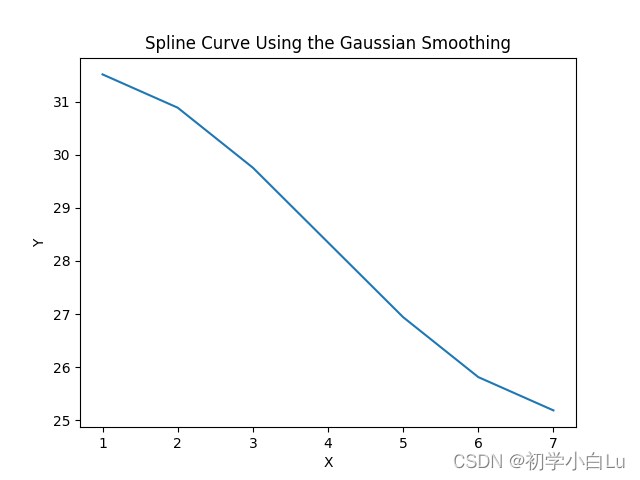
import numpy as np
from scipy.interpolate import make_interp_spline
import matplotlib.pyplot as plt
x=np.array([1,2,3,4,5,6,7])
y=np.array([100,50,25,12.5,6.25,3.125,1.5625])
model=make_interp_spline(x, y)
xs=np.linspace(1,7,500)
ys=model(xs)
plt.plot(xs, ys)
plt.title("Smooth Spline Curve")
plt.xlabel("X")
plt.ylabel("Y")
plt.show()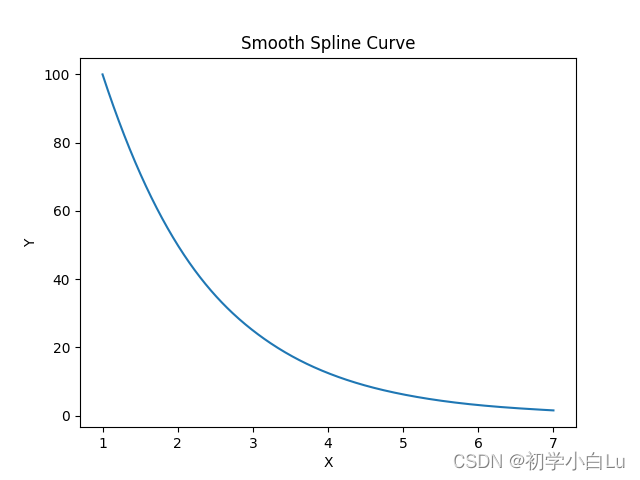
它通过使用 scipy.interpolate.make_interp_spline() 首先确定花键曲线的系数,绘制出一条平滑的花键曲线。我们用给定的数据来估计花样曲线的系数,然后用系数来确定间隔紧密的 x 值的 y 值,使曲线平滑。绘制曲线需要沿 X 轴 1 到 7 之间间隔相等的 500。
import numpy as np
from scipy.interpolate import interp1d
import matplotlib.pyplot as plt

x=np.array([1,2,3,4,5,6,7])
y=np.array([100,50,25,12.5,6.25,3.125,1.5625])

cubic_interploation_model=interp1d(x,y,kind="cubic")
xs=np.linspace(1,7,500)
ys=cubic_interploation_model(xs)
plt.plot(xs, ys)
plt.title("Spline Curve Using Cubic Interpolation")
plt.xlabel("X")
plt.ylabel("Y")
plt.show()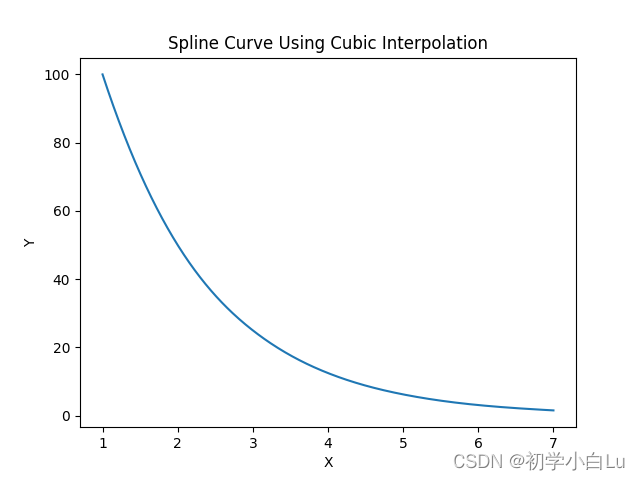
绘制曲线时,需要在 X 轴上 1 和 7 之间取间隔相等的 500 个点。
import numpy as np
import matplotlib.pyplot as plt
import matplotlib.animation as animation
from scipy.interpolate import interp1d

fig = plt.figure(figsize=(7, 2), dpi=100)
ax = plt.subplot()
x = np.array([1, 2, 3, 4, 5, 6, 7])
y = np.array([100, 50, 25, 12.5, 6.25, 3.125, 1.5625])
cubic_interploation_model = interp1d(x, y, kind="cubic")
xs = np.linspace(1, 7, 500)
ys = cubic_interploation_model(xs)
line3 = ax.plot(xs, ys)
def update(frame):
    line3[0].set_data(xs[:frame], ys[:frame])
ani = animation.FuncAnimation(fig, update, interval=10)
plt.show()
