Matplotlib 是 Python 的绘图库,它能让使用者很轻松地将数据图形化,并且提供多样化的输出格式。
Matplotlib 可以用来绘制各种静态,动态,交互式的图表。
Matplotlib 是一个非常强大的 Python 画图工具,我们可以使用该工具将很多数据通过图表的形式更直观的呈现出来。
Matplotlib 可以绘制线图、散点图、等高线图、条形图、柱状图、3D 图形、甚至是图形动画等等。
下面看下matplotlib 双y轴绘制及合并图例。
# -*- coding: utf-8 -*-
 import numpy as np
 import matplotlib.pyplot as plt
 from matplotlib import rc
 rc('mathtext', default='regular')

 time = np.arange(10)
 temp = np.random.random(10)*30
 Swdown = np.random.random(10)*100-10
 Rn = np.random.random(10)*100-10

 fig = plt.figure()
 ax = fig.add_subplot(111)
 ax.plot(time, Swdown, '-', label = 'Swdown')
 ax.plot(time, Rn, '-', label = 'Rn')
 ax2 = ax.twinx()
 ax2.plot(time, temp, '-r', label = 'temp')
 ax.legend(loc=0)
 ax.grid()
 ax.set_xlabel("Time (h)")
 ax.set_ylabel(r"Radiation ($MJ\,m^{-2}\,d^{-1}$)")
 ax2.set_ylabel(r"Temperature ($^circ$C)")
 ax2.set_ylim(0, 35)
 ax.set_ylim(-20,100)
 ax2.legend(loc=0)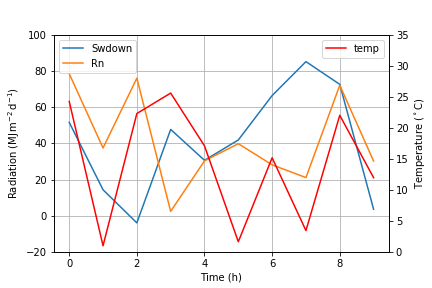
# -*- coding: utf-8 -*-
 import numpy as np
 import matplotlib.pyplot as plt
 from matplotlib import rc
 rc('mathtext', default='regular')

 time = np.arange(10)
 temp = np.random.random(10)*30
 Swdown = np.random.random(10)*100-10
 Rn = np.random.random(10)*100-10


 fig = plt.figure()
 ax = fig.add_subplot(111)

 lns1 = ax.plot(time, Swdown, '-', label = 'Swdown')
 lns2 = ax.plot(time, Rn, '-', label = 'Rn')
 ax2 = ax.twinx()
 lns3 = ax2.plot(time, temp, '-r', label = 'temp')


 # added these three lines
 lns = lns1+lns2+lns3
 labs = [l.get_label() for l in lns]
 ax.legend(lns, labs, loc=0)


 ax.grid()
 ax.set_xlabel("Time (h)")
 ax.set_ylabel(r"Radiation ($MJ\,m^{-2}\,d^{-1}$)")
 ax2.set_ylabel(r"Temperature ($^circ$C)")
 ax2.set_ylim(0, 35)
 ax.set_ylim(-20,100)

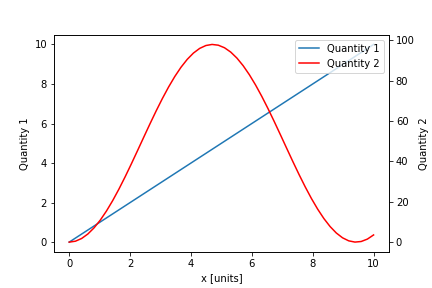
# -*- coding: utf-8 -*-
 import numpy as np
 import matplotlib.pyplot as plt

 x = np.linspace(0,10)
 y = np.linspace(0,10)
 z = np.sin(x/3)**2*98

 fig = plt.figure()
 ax = fig.add_subplot(111)
 ax.plot(x,y, '-', label = 'Quantity 1')

 ax2 = ax.twinx()
 ax2.plot(x,z, '-r', label = 'Quantity 2')
 fig.legend(loc=1, bbox_to_anchor=(1,1), bbox_transform=ax.transAxes)


 ax.set_xlabel("x [units]")
 ax.set_ylabel(r"Quantity 1")
 ax2.set_ylabel(r"Quantity 2")