$ npm install echarts --save
// 导入echarts 并将全部导入的命名为echarts
import * as echarts from 'echarts'
import { useEffect, useRef } from 'react'

const Home = () => {
  const domRef = useRef()

  useEffect(() => {
    chartTnit()
  }, [])

  const chartTnit = () => {
    // 基于准备好的dom,初始化echarts实例
    const myChart = echarts.init(domRef.current)

    // 绘制图表
    myChart.setOption({
      title: {
        text: 'ECharts 入门示例'
      },
      tooltip: {},
      xAxis: {
        data: ['衬衫', '羊毛衫', '雪纺衫', '裤子', '高跟鞋', '袜子']
      },
      yAxis: {},
      series: [
        {
          name: '销量',
          type: 'bar',
          data: [5, 20, 36, 10, 10, 20]
        }
      ]
    })
  }

  return (<div>
    {/* 挂载节点 */}
    <div ref={domRef} style={{ width: '500px', height: '500px' }}></div>
  </div>)
}
export default Home$ npm install @ant-design/charts --save
 import React from 'react'
// 引入Column柱状图表
import { Column } from '@ant-design/charts'

const Home = () => {

  const data = [
    { type: '家具家电', sales: 38 },
    { type: '粮油副食', sales: 52 },
    { type: '生鲜水果', sales: 61 },
    { type: '美容洗护', sales: 145 },
    { type: '母婴用品', sales: 48 },
    { type: '进口食品', sales: 38 },
    { type: '食品饮料', sales: 38 },
    { type: '家庭清洁', sales: 38 },
  ]
  const config = {
    data,
    xField: 'type',
    yField: 'sales',
    label: {
      // 可手动配置 label 数据标签位置
      position: 'middle',
      // 'top', 'bottom', 'middle',
      // 配置样式
      style: {
        fill: '#FFFFFF',
        opacity: 0.6,
      },
    },
    xAxis: {
      label: {
        autoHide: true,
        autoRotate: false,
      },
    },
    meta: {
      type: {
        alias: '类别',
      },
      sales: {
        alias: '销售额',
      },
    },
  }
  return <div>
    <Column {...config} />
  </div>
}
export default Home
这里名字为Bar,目录结构如下:
// Bar组件  子组件
import * as echarts from 'echarts'
import { useEffect, useRef } from 'react'

// 将用来自定义的提取出来
const Bar = ({ title, xData, yData, style }) => {
  const domRef = useRef()

  useEffect(() => {
    chartTnit()
  }, [])

  const chartTnit = () => {
    // 基于准备好的dom,初始化echarts实例
    const myChart = echarts.init(domRef.current)

    // 绘制图表
    myChart.setOption({
      title: {
        text: title
      },
      tooltip: {},
      xAxis: {
        data: xData
      },
      yAxis: {},
      series: [
        {
          name: '销量',
          type: 'bar',
          data: yData
        }
      ]
    })
  }

  return (<div>
    {/* 挂载节点 */}
    <div ref={domRef} style={style}></div>
  </div>)
}
export default Bar
//Home组件 父组件
import Bar from '@/components/Bar'
const Home = () => {
return (<div>
{/* 使用Bar组件 */}
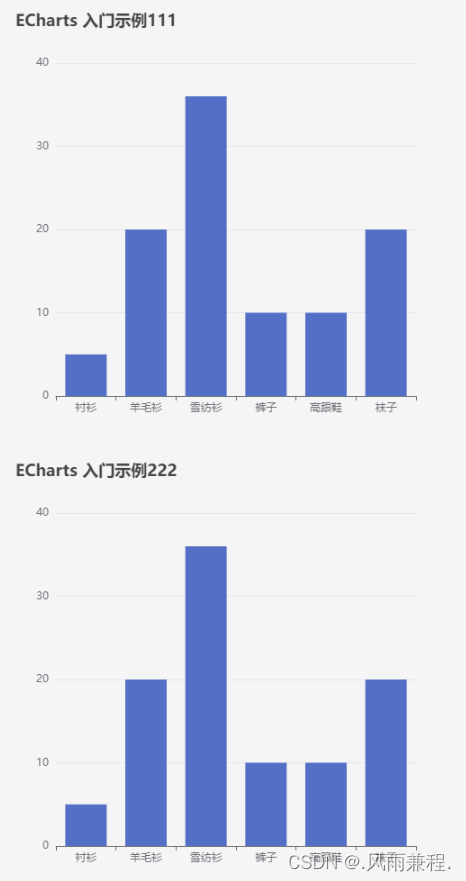
<Bar
title='ECharts 入门示例111'
xData={['衬衫', '羊毛衫', '雪纺衫', '裤子', '高跟鞋', '袜子']}
yData={[5, 20, 36, 10, 10, 20]}
style={{ width: '500px', height: '500px' }} />
<Bar
title='ECharts 入门示例222'
xData={['衬衫', '羊毛衫', '雪纺衫', '裤子', '高跟鞋', '袜子']}
yData={[5, 20, 36, 10, 10, 20]}
style={{ width: '500px', height: '500px' }} />
</div>)
}
export default Home