
// data
domImg: require('@/assets/images/largescreen/nation/map_bg.png'),

// js 渲染地图之前
var domImg = document.createElement("img");
domImg.style.height = domImg.height = domImg.width = domImg.style.width = "100px";
domImg.src = that.domImg;

// js 渲染地址时,在地图配置项geo中itemStyle
normal: {
    areaColor: {
        type: "pattern",
        image: domImg, //配置图片
        repeat: "repeat", //可选值repeat、no-repeat、repeat-x、repeat-y
    },
}
首先来看单层加粗外边框,其实很简单。咱们看一下效果
// 在地图配置项series中添加样式,效果如下图
itemStyle: {
       normal: {
           areaColor: '#3075b2',
           borderColor: '#4c99f9',
           borderWidth: 1
       },
       emphasis: {
           areaColor: '#01215c'
       }
}
// 在地图的配置项geo中设置,效果如下图
itemStyle: {
       normal: {
           areaColor: '#01215c',
           borderWidth: 5,//设置外层边框
           borderColor:'#9ffcff',
       }
}
在地图配置项series、geo中设置边框,单独设置就是上图所示。一起设置如下图,中间边框细,外轮廓边框粗的效果。
外轮廓加投影就是在 geo中添加 shadowColor设置,以及偏移shadowOffsetX、shadowOffsetY、shadowBlur。
如果想要多层外轮廓,就是在geo设置多个对象。
// 通过偏移,缩放来实现多层外轮廓的效果
this.option.geo = [
          {
            // 主图
            map: map,
            zlevel: 0,
            zoom: 1.2, //当前视角的缩放比例
            roam: false, //是否开启平游或缩放
            center: undefined,
            show: true,
            label: {
              normal: {
                show: false,
              },
              emphasis: {
                show: false,
              },
            },
            itemStyle: {
              normal: {
                borderColor: "rgba(141, 199, 255,1)",
                borderWidth: 1,
                areaColor: {
                  type: "pattern",
                  image: domImg, //配置图片
                  repeat: "repeat", //可选值repeat、no-repeat、repeat-x、repeat-y
                },
              },
              emphasis: {
                areaColor: "#2d9eff", //悬浮区背景
                shadowColor: "rgba(20, 113, 255,1)",
                shadowOffsetX: -2,
                shadowOffsetY: 5,
                shadowBlur: 10,
              },
            },
          },
          //第一层投影
          {
            map: map,
            zlevel: -1,
            zoom: 1.22, //当前视角的缩放比例
            roam: false, //是否开启平游或缩放
            center: undefined,
            show: true,
            label: {
              normal: {
                show: false,
              },
              emphasis: {
                show: false,
              },
            },
            itemStyle: {
              normal: {
                borderJoin: "round",
                borderColor: "rgba(176,228,252,1)",
                borderWidth: 3,
                areaColor: "rgba(133,188,232,1)",
                shadowColor: "rgba(133,188,232,.7)",
                shadowOffsetX: 0,
                shadowOffsetY: 0,
                shadowBlur: 25,
              },
              emphasis: {
                show: false,
              },
            },
          },
          // 第二层投影
          {
            map: map,
            zlevel: -2,
            zoom: 1.2, //当前视角的缩放比例
            roam: false, //是否开启平游或缩放
            center: undefined,
            show: true,
            label: {
              normal: {
                show: false,
              },
              emphasis: {
                show: false,
              },
            },
            itemStyle: {
              normal: {
                borderJoin: "round",
                areaColor: "rgba(30,49,105,1)",
                shadowColor: "rgba(30,49,105,1)",
                shadowOffsetX: -5,
                shadowOffsetY: 6,
              },
              emphasis: {
                show: false,
              },
            },
          },
}
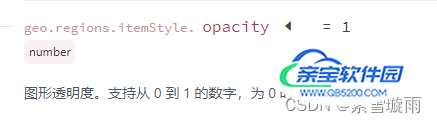
在echarts中regions是对特定的区域配置样式,opacity中0的时候不会绘制该图形,所以根据regions配置项来清除一部分图形。这样一来,直接在一个map上是不能实现海岸线效果的。那就需要两个div地图来实现海岸线效果。一层map是顶层的,完整数据的地图,一层是去掉海岸想相关数据的地图层。

// 首先把一部分图形隐藏
regionsOption:[
    {
      name: "北京市",
      itemStyle: {
        // 隐藏地图
        normal: {
          opacity: 0, // 为 0 时不绘制该图形
        }
      },
      label: {
        show: false // 隐藏文字
      }
    },

    ......

    {
      name: "南海诸岛",
      itemStyle: {
        // 隐藏地图
        normal: {
          opacity: 0, // 为 0 时不绘制该图形
        }
      },
      label: {
        show: false // 隐藏文字
      }
    },
]完整的地图数据我是从DataV.GeoAtlas下载的。
对某些省份图形的隐藏之后,发现,辽宁、广西在海岸线中只占一部分,就不能根据隐藏图形来实现了。但是可以修改地图绘制的经纬度,把辽宁、广西的一部分经纬度绘制去掉就可以得到下图效果。 下载海岸线除去辽宁广西部分经纬度json数据

数据高亮显示,在地图配置项series中data中设置itemStyle.areaColor。还可以加scatter,effectScatter都可以,根据需求来定。
// series-map.data.itemStyle地图数据高亮显示
var data = [
    { name: '天津', value: 4075, itemStyle: {areaColor: '#faa'} },
    { name: '湖北', value: 500, itemStyle: {areaColor: '#faa'} }
];


// series-effectScatter带有涟漪特效动画的散点(气泡)图
// this.convertData() 的数据格式:根据获取地图的数据,筛选出和data对应的数据,格式:[{name: 'name', value: 'value'}]
{
          type: "effectScatter",
          coordinateSystem: "geo",
          data: this.convertData(),
          // geoIndex:1,
          symbolSize: function (val) {
            return 10;
          },
          showEffectOn: "render",
          rippleEffect: {
            brushType: "stroke",
          },
          hoverAnimation: true,
          label: {
            normal: {
              formatter: "{b}",
              position: "top",
              show: true,
              color: "#fff",
              fontSize: 10,
              fontWeight: 800,
            },
          },
          itemStyle: {
            normal: {
              color: "#fdfbcc",
              shadowBlur: 10,
              shadowColor: "#fdfbcc",
            },
          },
          zlevel: 1,
        },
根据dispatchAction来设置地图的配置项,和定时器相结合来实现滚动高亮显示
// 设置鼠标移入移出地图以及点击地图
mounted() {
    this.$nextTick(() => {
      this.initEcharts();
      let that = this;
      this.chart.on("click", this.echartsMapClick);
      this.chart.on("mouseover", this.echartsMapMouseover);
      this.chart.on("mouseout", this.echartsMapMouseout);
    })
}


    // 地图鼠标移入事件
    echartsMapMouseover() {
      clearInterval(this.tooltipAutoplay);
    },
    // 地图鼠标移出事件
    echartsMapMouseout() {
      this.setTooltipAutoplay();
    },
    // 动态显示tooltip
    setTooltipAutoplay() {
      clearInterval(this.tooltipAutoplay);
      var index = 0; //播放所在下标
      var itemIndexList = new Array(this.mapDataList.length); //固定数组长度为3
      for (var i = 0; i < itemIndexList.length; i++) {
        itemIndexList[i] = i;
      }
      this.tooltipAutoplay = setInterval(() => {
        this.chart.dispatchAction({
          type: "downplay",
          seriesIndex: 0,
          dataIndex: itemIndexList,
        });
        this.chart.dispatchAction({
          type: "showTip",
          seriesIndex: 0,
          dataIndex: this.tooltipAutoplayIndex,
        });
        this.chart.dispatchAction({
          type: "highlight",
          seriesIndex: 0,
          dataIndex: this.tooltipAutoplayIndex,
        });
        this.tooltipAutoplayIndex++;
        if (this.tooltipAutoplayIndex >= this.mapDataList.length) {
          this.tooltipAutoplayIndex = 0;
          this.setTooltipAutoplay();
        }
      }, 6666);
    },