plt.show()展示图片的时候,截图进行保存,图片不是多么清晰
如何保存高清图也是一知识点
函数包名:import matplotlib.pyplot as plt
保存绘制数据后创建的图形。使用此方法可以将创建的图形保存
savefig(fname, dpi=None, facecolor='w', edgecolor='w', orientation='portrait', papertype=None,
format=None, transparent=False, bbox_inches=None, pad_inches=0.1, frameon=None, metadata=None)
| 参数 | 描述 |
|---|---|
| fname | 指定格式图片或者指定文件位置 |
| dpi | 画质 |
| facecolor 和 edgecolor | 默认为白色 |
| Orientation | 横向或者纵向 |
| papertype | 纸张类型 |
| format | 如png、pdf |
| transparent | 图片背景透明 |
| bbox_inches | 图表多余的空白区去除 |
| pad_inches | 保存图形周围填充 |
正常保存:plt.savefig("xx.png"),也可以svg的格式进行保存
保存的时候需要plt.show()在plt.savefig()之后,顺序颠倒会出现图片为空白。
当前文件保存:
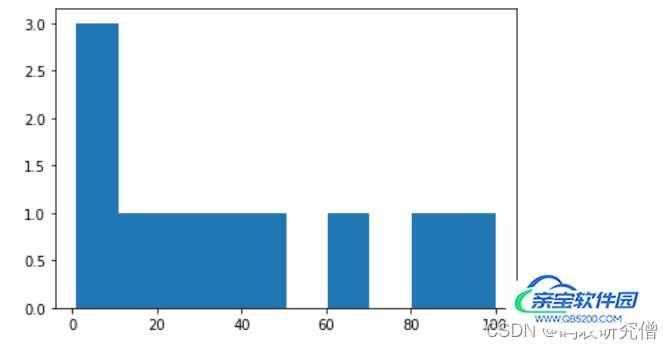
要把所有的参数用上,可以用在直方图上
import matplotlib.pyplot as plt

x =[1, 4, 9, 16, 25, 36, 49, 64, 81, 100]
plt.hist(x)

plt.savefig("squares1.png",
            bbox_inches ="tight",
            pad_inches = 1,
            transparent = True,
            facecolor ="g",
            edgecolor ='w',
            orientation ='landscape')

plt.show()
截图如下:
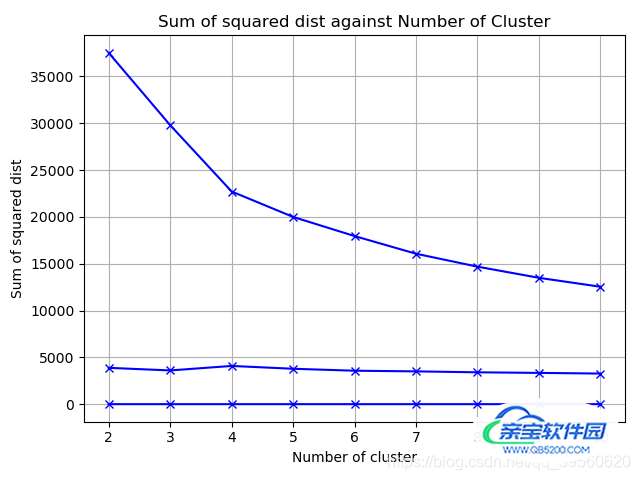
问题描述:
在多次调用plt.savefig()时,出现了保存的图片有上一个数据出现并重叠的现象。如下图:
部分代码:
import matplotlib.pyplot as plt

def ch_graph(num_clusters, ch_score, filepath, method, module):
    # Plot ch graph
    plt.plot(num_clusters, ch_score, 'bx-')
    plt.xlabel('Number of cluster')
    plt.ylabel('Calinski-Harabasz Score')
    plt.title('Calinski-Harabasz Score against Number of Cluster')
    plt.grid(True)
	filename = 'ch_graph_one.png'

    folder = 'Picture/'
    ch_filepath = filepath + '/' + folder + filename
    plt.savefig(ch_filepath)

def elbow_graph(num_clusters, Sum_of_squared_distances, filepath, method, module):
    # Plot ch graph
    plt.plot(num_clusters, Sum_of_squared_distances, 'bx-')
    plt.xlabel('Number of cluster')
    plt.ylabel('Sum of squared dist')
    plt.title('Sum of squared dist against Number of Cluster')
    plt.grid(True)

    filename = 'elbow_graph_one.png'
    folder = 'Picture/'
    elbow_filepath = filepath + '/' + folder + filename
    plt.savefig(elbow_filepath)
解决方法:
在plt.savefig()的下一行加上plt.close()就可以了。对于使用seaborn来绘制的图片,也同样使用plt.close()。
plt.close()内可输入的参数为:
另外,有时候也会因为没有关闭上一个canvas, 导致出现以下问题:
fig.canvas.draw_idle() # need this if 'transparent=True' to reset colors

