本文主要讲解使用Echarts时setOption里面的属性以及常见的问题,参数都是本人项目里的具体参数。设置内容都是在 setOption({ })中。
图示:
title:设置图标标题
title: {
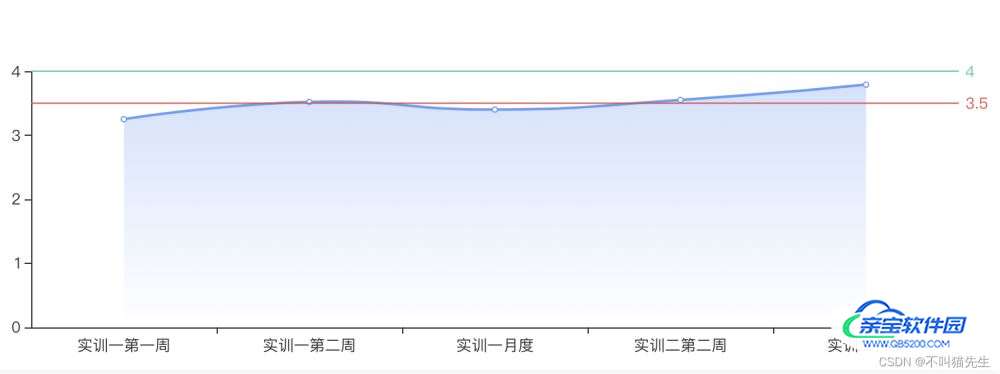
text: '答辩评分趋势',
left: 'left',
top: 20,
left: 20,
textStyle: {
color: '#679CF6'
}
}
tooltip:提示框
   tooltip: {
             trigger: 'axis',
             // 显示延迟,添加显示延迟可以避免频繁切换,单位ms
             showDelay: 200,
             // 坐标轴指示器,坐标轴触发有效
             axisPointer: {
                  // 默认为直线,可选为:'line' | 'shadow'
                  type: 'show',
                  shadowStyle: {
                          shadowBlur: 1,
                          opacity: 0.3
                              }
                     },
           },
grid:图表距离容器的位置
 grid: {
          left: '4%',
          right: '4%',
          bottom: '4%',
          top: '30%',
          containLabel: true
     },
- containLabel 为 false 的时候:
grid.left grid.right grid.top grid.bottom grid.width grid.height 决定的是由坐标轴形成的矩形的尺寸和位置。- containLabel 为 true 的时候:
grid.left grid.right grid.top grid.bottom grid.width grid.height 决定的是包括了坐标轴标签在内的所有内容所形成的矩形的位置。- 这常用于『防止标签溢出』的场景,标签溢出指的是,标签长度动态变化时,可能会溢出容器或者覆盖其他组件
legend:图例
  legend: {
         data: ['xx', 'xx', 'xx', 'xx'],
         right: '33%',
         top: '10%',
         textStyle: {
                 fontSize: 12,
                 color: '#666'
        },
           icon: "circle",
           itemWidth: 10,  // 设置宽度
           itemHeight: 10, // 设置高度
           itemGap: 40 // 设置间距
     },
xAxis :x轴设置
- axisLabel:设置x轴文字样式
- textStyle:文字样式,对象类型
- show:是否展示
- fontSize:字体大小
- color:文字颜色
- formatter:自定义文字,后面跟一个函数,默认会一个参数,x坐标的值
	xAxis: {
		type: "value",
			// x轴的名字,可以理解成单位
			name: "单位(K)",
				nameTextStyle: {
			// x轴的名字的样式相关
			color: "#BFBFBF",
				nameLocation: "start",
                    },
		splitLine: {
			//去除网格线
			show: false,
                    },
		//去除网格区域,否则会有一片区域
		splitArea: { show: false },
		data: [0, 5000, 10000, 15000, 20000, 25000, 30000, 35000],
			axisLine: {
			// 把x轴从实线变成虚线
			show: true,
				lineStyle: {
				// 设置x轴线条样式的颜色
				color: "#BDBDBD",
					width: 1,
						type: "solid",
                        },
		},
		axisLabel: {
			formatter: function (value) {
				return value >= 5000 ? parseInt(value / 1000) + "K" : value;
			},
			scale: true, // 设置数据自动缩放
        }
	},
series:图标系列,对象类型
 series: [
                    {
                        data: this.trendLineData.map(item => item.defenceScore),
                        type: 'line',
                        smooth: true,
                        name: "答辩评分",
                        areaStyle: {
                            normal: {
                                opacity: 0.3,
                                color: new this.$echarts.graphic.LinearGradient(0, 0, 0, 1, [{
                                    offset: 0,
                                    color: '#679CF6'
                                }, {
                                    offset: 1,
                                    color: '#fff'
                                }])
                            }
                        },
                        // 基线设置
                        markLine: {
                            symbol: "none",
                            data: [{
                                silent: false,
                                lineStyle: {
                                    type: "solid",
                                    color: "#E34949",
                                },
                                yAxis: 3.5
                            },
                            {
                                silent: false,
                                lineStyle: {
                                    type: "solid",
                                    color: "#3BC9A9",
                                },
                                yAxis: 4
                            }
                            ]
                        }
                    },
                ],
   axisLabel: {
        formatter: function (value) {
              return value >= 5000 ? parseInt(value / 1000) + "K" : value;
           },
     scale: true, // 设置数据自动缩放,要不然数据多的话就堆一块了
   }
其中this.trendLineData为后端数据,其实就是将x轴的类目项文字可以动态换行
 		formatter: (value) => {
			if (this.trendLineData.length > 2) {
			    //拼接加\n返回的类目项
				var ret = "";
				//每项显示文字个数
				var maxLength = 12;
				//X轴类目项的文字个数
				var valLength = value.length;
				//类目项需要换行的行数
				var rowN = Math.ceil(valLength / maxLength);
				if (rowN > 1)
				{
					for (var i = 0; i < rowN; i++) {
					    //每次截取的字符串
						var temp = "";
						//开始截取的位置
						var start = i * maxLength;
						//结束截取的位置
						var end = start + maxLength;
						//这里也可以加一个是否是最后一行的判断
						temp = value.substring(start, end) + "\n";
						//拼接最终的字符串
						ret += temp;
					}
					return ret;
				}
				else {
					return value;
				}
			} else {
				return value;
			}
		}
	tooltip: {
		    trigger: 'axis',
		    // 显示延迟,添加显示延迟可以避免频繁切换,单位ms
			showDelay: 200,
			 // 坐标轴指示器,坐标轴触发有效
			axisPointer: {
			    // 默认为直线,可选为:'line' | 'shadow'
		     	type: 'shadow',
				shadowStyle: {
				shadowBlur: 1,
					opacity: 0.3
			    }
	     	},
		formatter: function (data) {
			var res = "<div style='display:flex;'>";
			res += "<div class='left' >"
			res += '答辩数' + '</br>'
			data.forEach(item => {
				item.value = item.value ? item.value : 0;
				if (item.seriesType == 'bar') {
					res += item.marker + item.seriesName + '答辩数' + ':' + item.value + '</br>';
				}
			});
			res += " </div>"
			res += "<div class='right' style='margin-left:20px'>"
			res += '分数' + '</br>'
			data.forEach(item => {
				item.value = item.value ? item.value : 0;
				if (item.seriesType == 'line') {
					res += item.marker + item.seriesName + (item.seriesName == '总体' ? '平均分' : '分数') + ':' + item.value + '</br>';
				}
			});
			res += " </div>"
			res += " </div>"
			return res
		}
	},
结果如图所示: