一、Console API
Console.assert()
判断第一个参数是否为真,false的话抛出异常并且在console输出相应信息。
Console.count()
以参数为标识记录调用的次数,调用时在console打印标识以及调用次数。
Console.debug()
console.log方法的别称,使用方法可以参考Console.log()
Console.dir()
打印一条以三角形符号开头的语句,可以点击三角展开查看对象的属性。
Console.error()
打印一条错误信息,使用方法可以参考 string substitution。
Console._exception()
error方法的别称,使用方法参考Console.error()
Console.group()
打印树状结构,配合groupCollapsed以及groupEnd方法;
Console.groupCollapsed()
使用方法和group相同,不同的是groupCollapsed打印出来的内容默认是折叠的。
Console.groupEnd()
结束当前Tree
Console.info()
打印以感叹号字符开始的信息,使用方法和log相同
Console.log()
打印字符串,使用方法比较类似C的printf格式输出
Console.profile()
可以以第一个参数为标识,开始javascript执行过程的数据收集。和chrome控制台选项开Profiles比较类似,具体可参考chrome profiles
Console.profileEnd()
配合profile方法,作为数据收集的结束。
Console.table()
将数据打印成表格。Console.table [en-US]
Console.time()
计时器,接受一个参数作为标识。
Console.timeEnd()
接受一个参数作为标识,结束特定的计时器。
Console.trace()
打印stack trace.
Console.warn()
打印一个警告信息,使用方法可以参考 string substitution。
二、用法
1、Console.log
旧版兼容
if(!window.console){ window.console = {log: function(){} }; }
输出对象
var someObject = { str: "Some text", id: 5 };
console.log(someObject);
//Object {str: "Some text", id: 5}
格式化
%s 格式string
%d or %i 格式int
%f 格式float
%o 格式Object对象
%O 格式object对象
%c 格式css
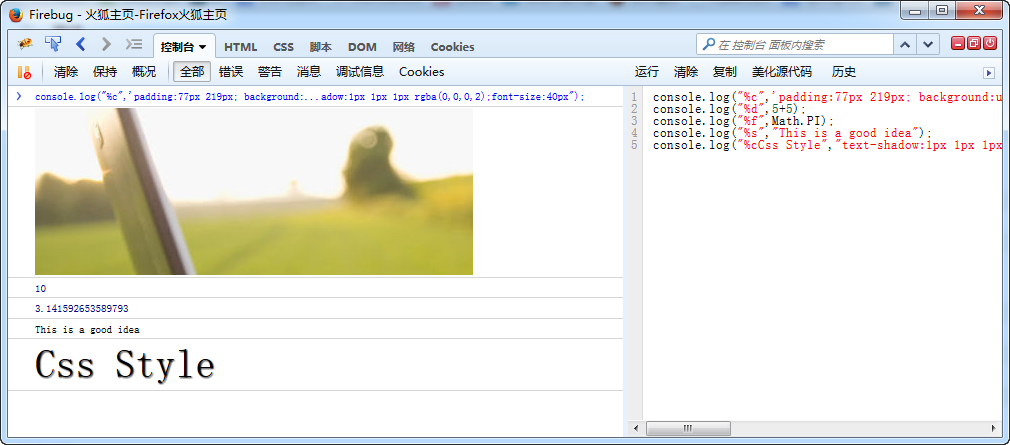
输出对象
console.log("%o",document.body);
console.log("%O",document.body);

console.log("%c",'padding:77px 219px; background:url(http://www.erongtu.com/application/uploads/ask/2015-10-20/5625a690f0ddd.jpg) no-repeat;line-height:166px;height:166px;');
console.log("%d",5+5);
console.log("%f",Math.PI);
console.log("%s","This is a good idea");
console.log("%cCss Style","text-shadow:1px 1px 1px rgba(0,0,0,2);font-size:40px");
Google chrome 46.0.2490.71 m 上图片出不来
Firefox 41.0.2 下测试
不过网上有一个有趣的东西 console.image,chrome自带的有扩展 https://github.com/jffry/console.image-chrome-extension
console.image("http://i.imgur.com/hv6pwkb.png");
console.image("http://i.imgur.com/hv6pwkb.png");
console.image("http://i.imgur.com/hv6pwkb.png");
console.image("http://i.imgur.com/hv6pwkb.png");
源代码地址:https://github.com/adriancooney/console.image
2、console.info/console.log
var car = "Dodge Charger";
var someObject = {str:"Some text", id:5};
console.info("My first car was a", car, ". The object is: ", someObject);
for (var i=0; i<5; i++) {
console.log("Hello, %s. You've called me %d times.", "Bob", i+1);
}
console.log("I want to print a number:%d","string")

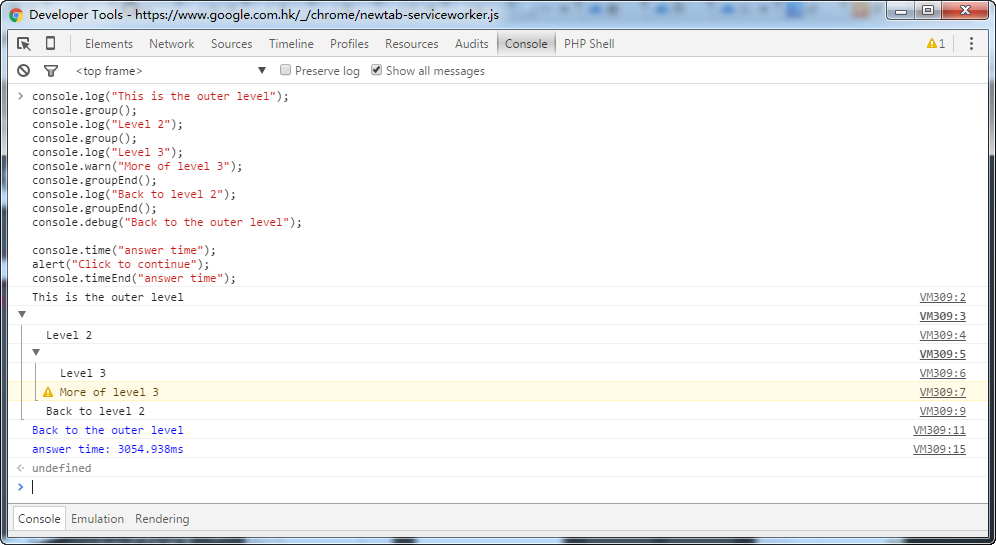
3、console.group/console.warn/console.time/console.debug
console.log("This is the outer level");
console.group();
console.log("Level 2");
console.group();
console.log("Level 3");
console.warn("More of level 3");
console.groupEnd();
console.log("Back to level 2");
console.groupEnd();
console.debug("Back to the outer level");
console.time("answer time");
alert("Click to continue");
console.timeEnd("answer time");
4、console.trace 在页面console文档中查看堆栈跟踪的详细介绍和示例.这个比较好用
foo();
function foo() {
 function bar() {
  console.trace();
 }
 bar();
}

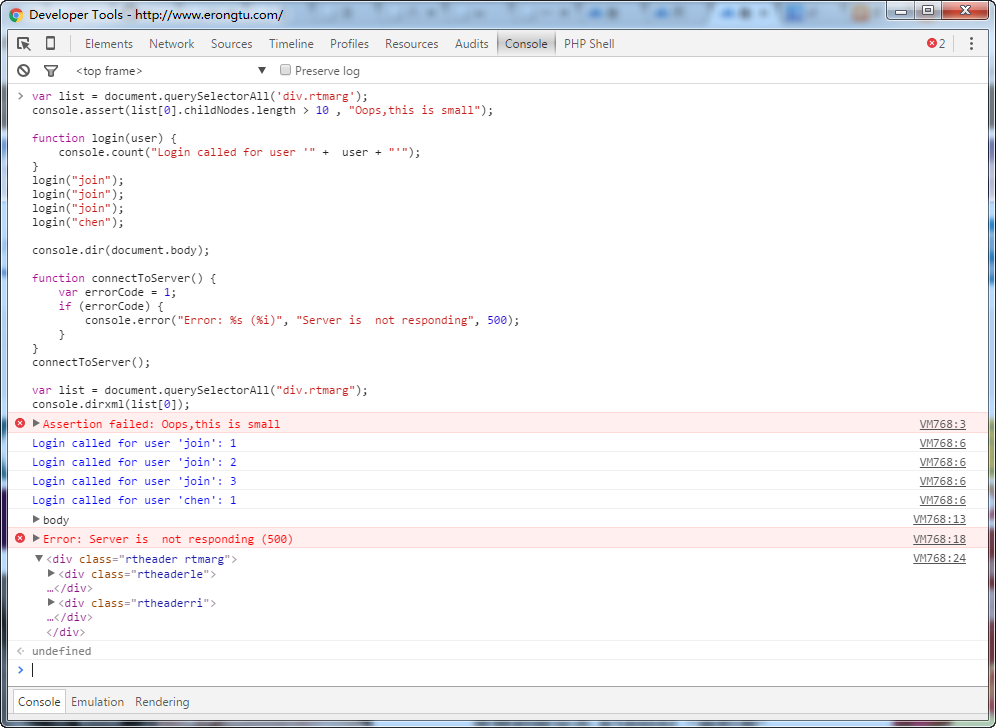
5、console.assert/console.count/console.dirxml/console.dir/console.error
var list = document.querySelectorAll('div.rtmarg');
console.assert(list[0].childNodes.length > 10 , "Oops,this is small");
function login(user) {
  console.count("Login called for user '" + user + "'");
}
login("join");
login("join");
login("join");
login("chen");
console.dir(document.body);
function connectToServer() {
  var errorCode = 1;
  if (errorCode) {
    console.error("Error: %s (%i)", "Server is not responding", 500);
  }
}
connectToServer();
var list = document.querySelectorAll("div.rtmarg");
console.dirxml(list[0]);
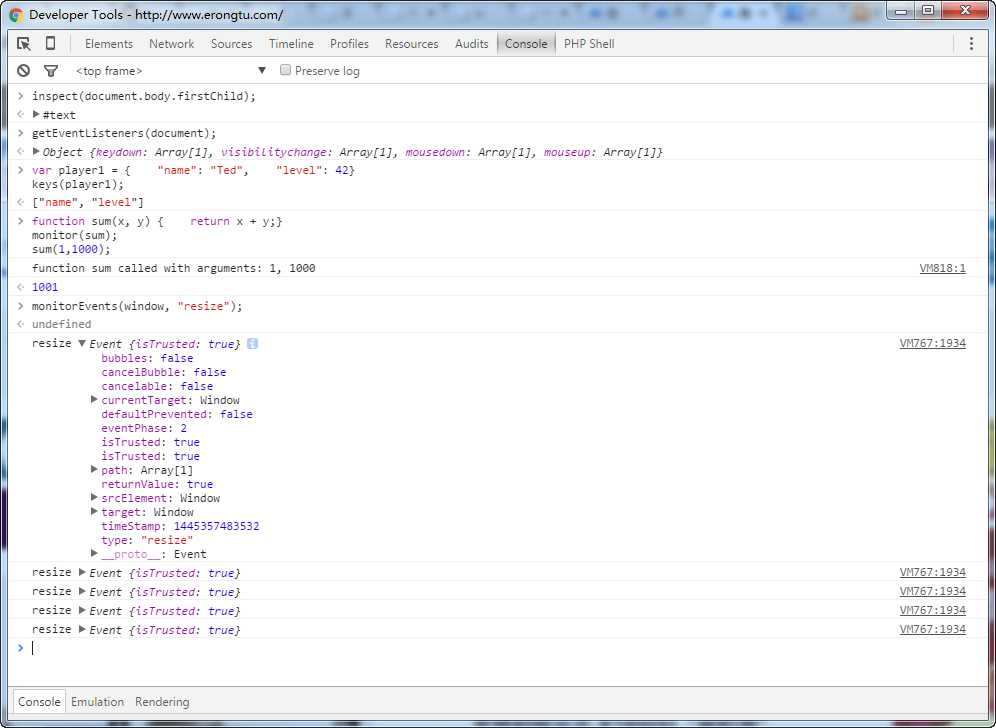
6、Other Command Line API
inspect(document.body.firstChild);
getEventListeners(document);
var player1 = {  "name": "Ted",  "level": 42}
keys(player1);
function sum(x, y) {  return x + y;}
monitor(sum);
monitorEvents(window, "resize");
7、debugger 非常好用的一个工具
brightness = function() {
  debugger;
  var r = Math.floor(this.red*255);
  var g = Math.floor(this.green*255);
  var b = Math.floor(this.blue*255);
  return (r * 77 + g * 150 + b * 29) >> 8;
}
brightness();
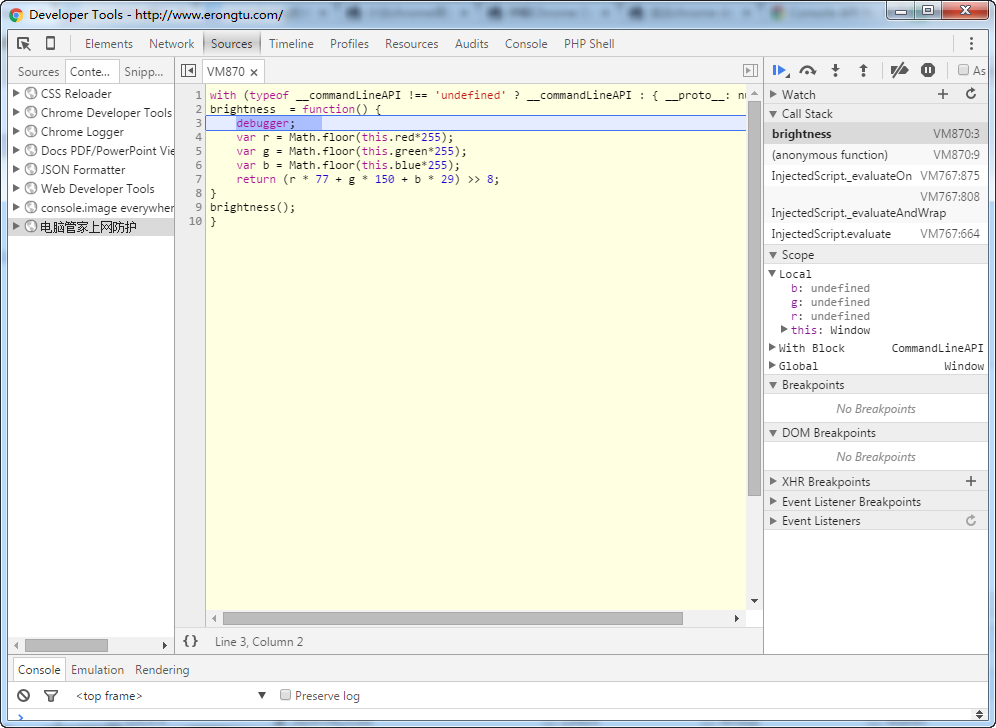
调试的时候还可以加断点什么的……
8、jquery相关 firequery
$.fn.log = function() {
  if (window.console && console.log) {
    console.log(this);
  }
  return this;
}
$('foo.bar').find(':baz').log().hide();
这样就可以 easily check inside jQuery chains.

四、相关资源
Firefox
http://getfirebug.com/
(you can also now use Firefox's built in developer tools Ctrl+Shift+J (Tools > Web Developer > Error Console), but Firebug is much better; use Firebug)
Safari and Chrome
Basically the same.
https:/https://img.qb5200.com/download-x/developer.chrome.comhttps://img.qb5200.com/download-x/devtools/index
https:/https://img.qb5200.com/download-x/developer.apple.com/technologies/safarihttps://img.qb5200.com/download-x/developer-tools.html
Internet Explorer
Don't forget you can use compatibility modes to debug IE7 and IE8 in IE9 or IE10
http://msdn.microsoft.com/en-us/library/ie/gg589507(v=vs.85).aspx
http://msdn.microsoft.com/en-us/libraryhttps://img.qb5200.com/download-x/dd565628(v=vs.85).aspx
If you must access the console in IE6 for IE7 use the Firebug Lite bookmarklet
http://getfirebug.com/firebuglite/ look for stable bookmarklet
http://en.wikipedia.org/wiki/Bookmarklet
Opera
http://www.opera.comhttps://img.qb5200.com/download-x/dragonfly/
iOS
Works for all iPhones, iPod touch and iPads.
http:/https://img.qb5200.com/download-x/developer.apple.com/library/ios/ipad/
Now with iOS 6 you can view the console through Safari in OS X if you plug in your device. Or you can do so with the emulator, simply open a Safari browser window and go to the "Develop" tab. There you will find options to get the Safari inspector to communicate with your device.
Windows Phone, Android
Both of these have no console built in and no bookmarklet ability. So we use http://jsconsole.com/type :listen and it will give you a script tag to place in your HTML. From then on you can view your console inside the jsconsole website.
iOS and Android
You can also use http://html.adobe.com/edge/inspect/ to access web inspector tools and the console on any device using their convenient browser plugin.
Older browser problems
Lastly older browsers (thanks again Microsoft) will crash if you use console.log in your code and not have the developer tools open at the same time. Luckily its an easy fix. Simple use the below code snippet at the top of your code and good old IE should leave you alone:
if(!window.console){ window.console = {log: function(){} }; }
This checks to see if the console is present, and if not it sets it to an object with a blank function calledlog. This way window.console and window.console.log is never truly undefined.
http://stackoverflow.com/questions/4539253/what-is-console-log
https:/https://img.qb5200.com/download-x/developer.chrome.comhttps://img.qb5200.com/download-x/devtoolshttps://img.qb5200.com/download-x/docs/console-api
https:/https://img.qb5200.com/download-x/developers.google.com/chrome-developer-toolshttps://img.qb5200.com/download-x/docs/console-api
http://getfirebug.com/wiki/index.php/Console_API
https:/https://img.qb5200.com/download-x/developer.chrome.comhttps://img.qb5200.com/download-x/devtoolshttps://img.qb5200.com/download-x/docs/console-api
https:/https://img.qb5200.com/download-x/developer.apple.com/library/safarihttps://img.qb5200.com/download-x/documentation/AppleApplications/Conceptual/Safari_Developer_Guide/Console/Console.html
https:/https://img.qb5200.com/download-x/developer.mozilla.org/zh-CNhttps://img.qb5200.com/download-x/docs/Web/API/Console

