本文着重讲解了Spring Boot Actuator监控的简单使用,文中会用代码示例图文相结合为大家做详细介绍,希望能够帮助到您,欢迎大家阅读
Spring Boot Actuator帮助我们实现了许多中间件比如mysql、es、redis、mq等中间件的健康指示器。
通过 Spring Boot 的自动配置,这些指示器会自动生效。当这些组件有问题的时候,HealthIndicator 会返回 DOWN 或 OUT_OF_SERVICE 状态,health 端点 HTTP 响应状态码也会变为 503,我们可以以此来配置程序健康状态监控报警。
使用步骤也非常简单,这里演示的是线程池的监控。模拟线程池满了状态下将HealthInicator指示器变为Down的状态。
pom中引入jar
<dependency>
 <groupId>org.springframework.boot</groupId>
 <artifactId>spring-boot-starter-actuator</artifactId>
<https://img.qb5200.com/download-x/dependency>
引入properties配置
spring.application.name=boot


# server.servlet.context-path=/boot
# management.server.servlet.context-path=/boot
# JVM (Micrometer)要求给应用设置commonTag
management.metrics.tags.application=${spring.application.name}
#去掉重复的metrics
spring.metrics.servo.enabled=false

management.endpoint.metrics.enabled=true
management.endpoint.metrics.sensitive=false
#显式配置不需要权限验证对外开放的端点
management.endpoints.web.exposure.include=*
management.endpoints.jmx.exposure.include=*

management.endpoint.health.show-details=always
#Actuator 的 Web 访问方式的根地址为 /actuator,可以通过 management.endpoints.web.base-path 参数进行修改
management.endpoints.web.base-path=/actuator
management.metrics.export.prometheus.enabled=true
代码
/**
* @Author jeffSmile
* @Date 下午 6:10 2020/5/24 0024
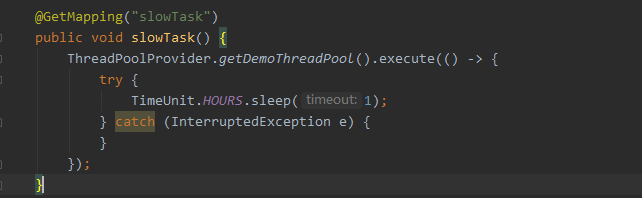
* @Description 定义一个接口,来把耗时很长的任务提交到这个 demoThreadPool 线程池,以模拟线程池队列满的情况
**/
@GetMapping("slowTask")
public void slowTask() {
ThreadPoolProvider.getDemoThreadPool().execute(() -> {
try {
TimeUnit.HOURS.sleep(1);
} catch (InterruptedException e) {
}
});
}
package com.mongo.boot.service;

import jodd.util.concurrent.ThreadFactoryBuilder;

import java.util.concurrent.ArrayBlockingQueue;
import java.util.concurrent.ThreadPoolExecutor;
import java.util.concurrent.TimeUnit;

public class ThreadPoolProvider {

 //一个工作线程的线程池,队列长度10
 private static ThreadPoolExecutor demoThreadPool = new ThreadPoolExecutor(
   1, 1,
   2, TimeUnit.SECONDS,
   new ArrayBlockingQueue<>(10),
   new ThreadFactoryBuilder().setNameFormat("demo-threadpool-%d").get());
 //核心线程数10,最大线程数50的线程池,队列长度50
 private static ThreadPoolExecutor ioThreadPool = new ThreadPoolExecutor(
   10, 50,
   2, TimeUnit.SECONDS,
   new ArrayBlockingQueue<>(100),
   new ThreadFactoryBuilder().setNameFormat("io-threadpool-%d").get());

 public static ThreadPoolExecutor getDemoThreadPool() {
  return demoThreadPool;
 }

 public static ThreadPoolExecutor getIOThreadPool() {
  return ioThreadPool;
 }
}
package com.mongo.boot.service;
import org.springframework.boot.actuate.health.Health;
import org.springframework.boot.actuate.health.HealthIndicator;
import java.util.HashMap;
import java.util.Map;
import java.util.concurrent.ThreadPoolExecutor;
/**
* @Author jeffSmile
* @Date 下午 6:12 2020/5/24 0024
* @Description 自定义的 HealthIndicator 类,用于单一线程池的健康状态
**/
public class ThreadPoolHealthIndicator implements HealthIndicator {
private ThreadPoolExecutor threadPool;
public ThreadPoolHealthIndicator(ThreadPoolExecutor threadPool) {
this.threadPool = threadPool;
}
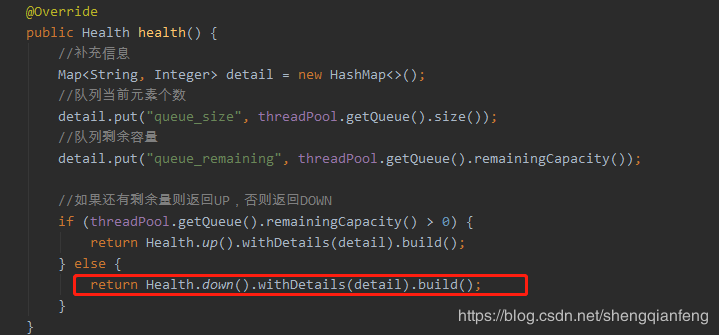
@Override
public Health health() {
//补充信息
Map<String, Integer> detail = new HashMap<>();
//队列当前元素个数
detail.put("queue_size", threadPool.getQueue().size());
//队列剩余容量
detail.put("queue_remaining", threadPool.getQueue().remainingCapacity());
//如果还有剩余量则返回UP,否则返回DOWN
if (threadPool.getQueue().remainingCapacity() > 0) {
return Health.up().withDetails(detail).build();
} else {
return Health.down().withDetails(detail).build();
}
}
}
package com.mongo.boot.service;

import org.springframework.boot.actuate.health.CompositeHealthContributor;
import org.springframework.boot.actuate.health.HealthContributor;
import org.springframework.boot.actuate.health.NamedContributor;
import org.springframework.stereotype.Component;

import java.util.HashMap;
import java.util.Iterator;
import java.util.Map;

/***
 * @Author jeffSmile
 * @Date 下午 6:13 2020/5/24 0024
 * @Description 定义一个 CompositeHealthContributor,来聚合两个 ThreadPoolHealthIndicator 的实例,
 * 分别对应 ThreadPoolProvider 中定义的两个线程池
 **/

@Component
public class ThreadPoolsHealthContributor implements CompositeHealthContributor {

 //保存所有的子HealthContributor
 private Map<String, HealthContributor> contributors = new HashMap<>();

 ThreadPoolsHealthContributor() {
  //对应ThreadPoolProvider中定义的两个线程池
  this.contributors.put("demoThreadPool", new ThreadPoolHealthIndicator(ThreadPoolProvider.getDemoThreadPool()));
  this.contributors.put("ioThreadPool", new ThreadPoolHealthIndicator(ThreadPoolProvider.getIOThreadPool()));
 }

 @Override
 public HealthContributor getContributor(String name) {
  //根据name找到某一个HealthContributor
  return contributors.get(name);
 }

 @Override
 public Iterator<NamedContributor<HealthContributor>> iterator() {
  //返回NamedContributor的迭代器,NamedContributor也就是Contributor实例+一个命名
  return contributors.entrySet().stream()
    .map((entry) -> NamedContributor.of(entry.getKey(), entry.getValue())).iterator();
 }
}
启动springboot验证
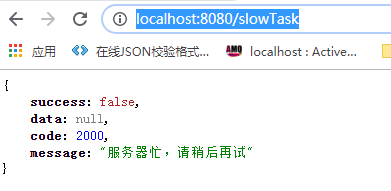
这里我访问:http://localhost:8080/slowTask
每次访问都向demo线程池中提交一个耗时1小时的任务,而demo线程池的核心和最大线程数都是1,队列长度为10,那么当访问11次之后,任务将被直接拒绝掉!

此时访问:http://localhost:8080/actuator/health
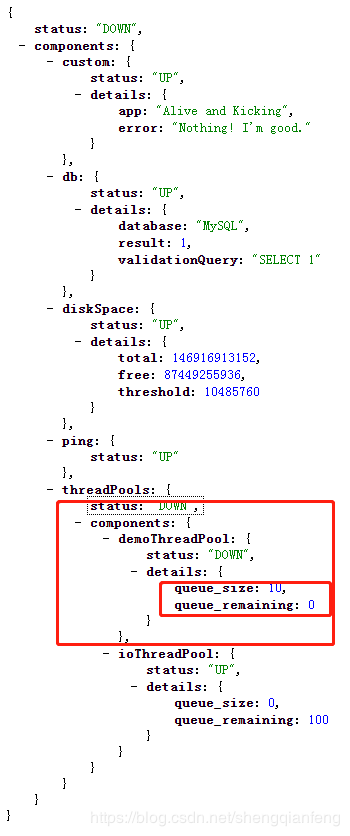
demo线程池队列已经满了,状态变为DOWN。
监控内部重要组件的状态数据
通过 Actuator 的 InfoContributor 功能,对外暴露程序内部重要组件的状态数据!
实现一个 ThreadPoolInfoContributor 来展现线程池的信息:
package com.mongo.boot.config;

import com.mongo.boot.service.ThreadPoolProvider;
import org.springframework.boot.actuate.info.Info;
import org.springframework.boot.actuate.info.InfoContributor;
import org.springframework.stereotype.Component;

import java.util.HashMap;
import java.util.Map;
import java.util.concurrent.ThreadPoolExecutor;


/**
 * @Author jeffSmile
 * @Date 下午 6:37 2020/5/24 0024
 * @Description 通过 Actuator 的 InfoContributor 功能,对外暴露程序内部重要组件的状态数据
 **/

@Component
public class ThreadPoolInfoContributor implements InfoContributor {

 private static Map threadPoolInfo(ThreadPoolExecutor threadPool) {
  Map<String, Object> info = new HashMap<>();
  info.put("poolSize", threadPool.getPoolSize());//当前池大小
  info.put("corePoolSize", threadPool.getCorePoolSize());//设置的核心池大小
  info.put("largestPoolSize", threadPool.getLargestPoolSize());//最大达到过的池大小
  info.put("maximumPoolSize", threadPool.getMaximumPoolSize());//设置的最大池大小
  info.put("completedTaskCount", threadPool.getCompletedTaskCount());//总完成任务数
  return info;
 }

 @Override
 public void contribute(Info.Builder builder) {
  builder.withDetail("demoThreadPool", threadPoolInfo(ThreadPoolProvider.getDemoThreadPool()));
  builder.withDetail("ioThreadPool", threadPoolInfo(ThreadPoolProvider.getIOThreadPool()));
 }
}
直接访问http://localhost:8080/actuator/info
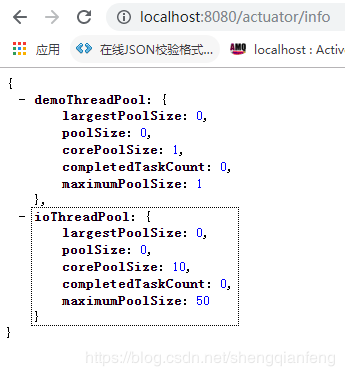
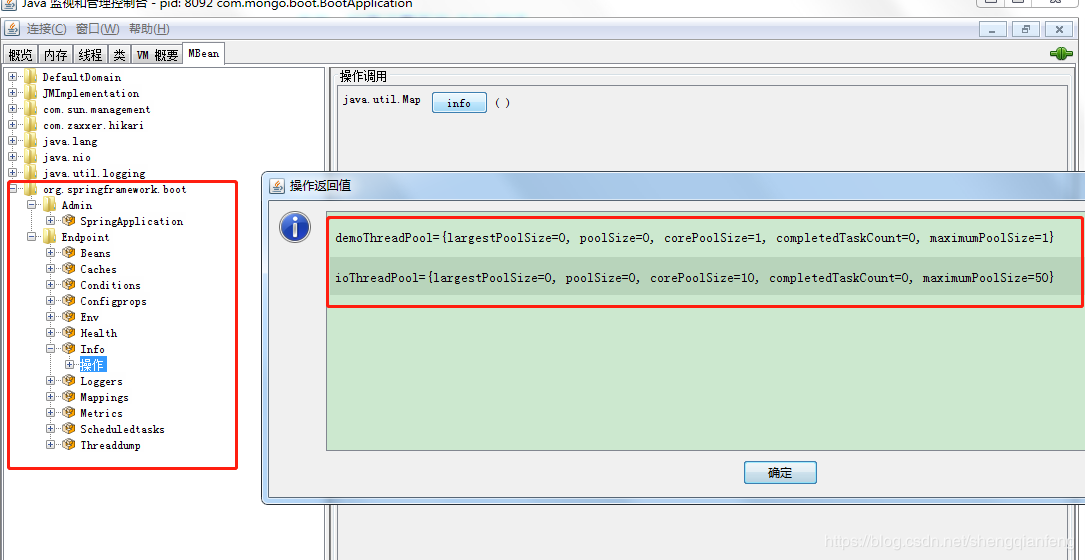
如果开启jmx,还可以使用jconsole来查看线程池的状态信息:
#开启 JMX
spring.jmx.enabled=true
打开jconcole界面之后,进入MBean这个tab,可以在EndPoint下的Info操作这里看到我们的Bean信息。
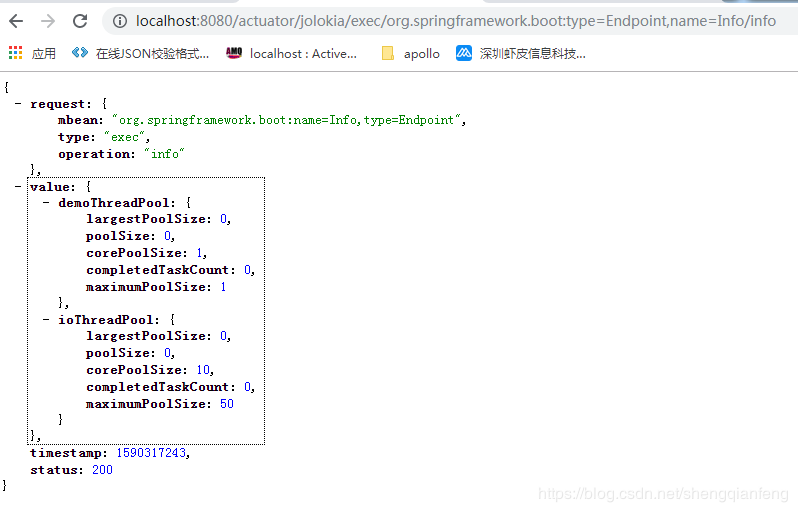
不过,除了jconsole之外,我们可以把JMX协议转为http协议,这里引入jolokia:
<dependency>
 <groupId>org.jolokia</groupId>
 <artifactId>jolokia-core</artifactId>
<https://img.qb5200.com/download-x/dependency>
重启后访问:http://localhost:8080/actuator/jolokia/exec/org.springframework.boot:type=Endpoint,name=Info/info
监控延伸
通过Micrometer+promethues+grafana的组合也可以进行一些生产级别的实践。

