本文着重讲解了基于Ionic3实现选项卡切换并重新加载echarts,文中通过代码实例讲解的非常细致,对大家的工作和学习具有一定的参考学习价值,欢迎大家阅读和收藏
要求
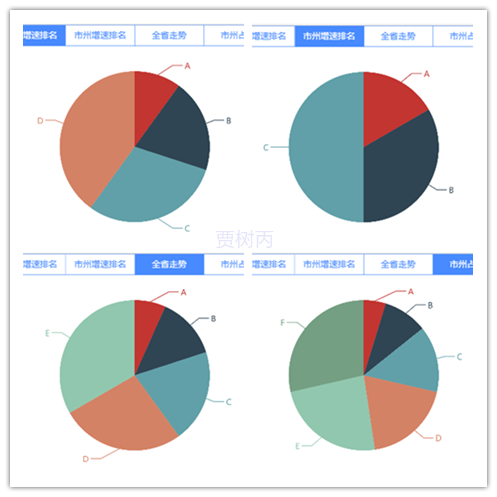
选项卡每切换一次,就加载对应的一个echarts 图,要有一开始的动画效果
效果如下:
注意点
1、echarts要想每次都能重新加载,需要移除"_echarts_instance_"属性,否则一切换选项卡,就再也加载不出来了
2、在ts 中获取html 页面元素,不能写在构造方法里,应该写在ionViewDidEnter()方法里
3、选项卡<ion-segment> 不要搭配[ngSwitch] 的方式,因为这种情况下,只能获取当前选项卡中的元素,未选中的选项卡里的元素获取不到,在第2步骤ionViewDidEnter() 方法里自然也是获取不到。应当搭配(ionChange)使用方式
4、不能直接将chart作为全局变量,这样的话第二次加载就没有动画效果了
献上代码
html文件
<ion-header>
 <ion-navbar>
  <ion-title>区域</ion-title>
 </ion-navbar>

</ion-header>

<ion-content padding>

  <ion-segment [(ngModel)]="choice" (ionChange)="segmentChanged($event)">
   <ion-segment-button value="choice1">
    省份增速排名
   </ion-segment-button>
   <ion-segment-button value="choice2">
    市州增速排名
   </ion-segment-button>
   <ion-segment-button value="choice3">
    全省走势
   </ion-segment-button>
   <ion-segment-button value="choice4">
    市州占比
   </ion-segment-button>
  </ion-segment>

  <div id="chartContainer" style="width: 100%; height: 300px;"></div>

</ion-content>
ts文件
import {Component} from '@angular/core';
import * as echarts from 'echarts';

@Component({
 selector: 'page-data-area',
 templateUrl: 'area.html'
})
export class DataAreaPage {
 choice: string = "choice1";
 ec: any = echarts;
 chartContainer: any;

 constructor() {
 }

 clickChart1() {
  const chart1 = this.ec.init(this.chartContainer);
  chart1.setOption({
   series: {
    type: 'pie',
    data: [{
     name: 'A',
     value: 10
    }, {
     name: 'B',
     value: 20
    }, {
     name: 'C',
     value: 30
    }, {
     name: 'D',
     value: 40
    }]
   }
  }, true);
  this.chartContainer.removeAttribute("_echarts_instance_");
 }

 clickChart2() {
  const chart2 = this.ec.init(this.chartContainer);
  chart2.setOption({
   series: {
    type: 'pie',
    data: [{
     name: 'A',
     value: 10
    }, {
     name: 'B',
     value: 20
    }, {
     name: 'C',
     value: 30
    }]
   }
  }, true);
  this.chartContainer.removeAttribute("_echarts_instance_");
 }

 clickChart3() {
  const chart3 = this.ec.init(this.chartContainer);
  chart3.setOption({
   series: {
    type: 'pie',
    data: [{
     name: 'A',
     value: 10
    }, {
     name: 'B',
     value: 20
    }, {
     name: 'C',
     value: 30
    }, {
     name: 'D',
     value: 40
    }, {
     name: 'E',
     value: 50
    }]
   }
  }, true);
  this.chartContainer.removeAttribute("_echarts_instance_");
 }

 clickChart4() {
  const chart4 = this.ec.init(this.chartContainer);
  chart4.setOption({
   series: {
    type: 'pie',
    data: [{
     name: 'A',
     value: 10
    }, {
     name: 'B',
     value: 20
    }, {
     name: 'C',
     value: 30
    }, {
     name: 'D',
     value: 40
    }, {
     name: 'E',
     value: 50
    }, {
     name: 'F',
     value: 60
    }]
   }
  }, true);
  this.chartContainer.removeAttribute("_echarts_instance_");
 }

 segmentChanged(e) {
  if (e.value == "choice1") {
   this.clickChart1();
  } else if (e.value == "choice2") {
   this.clickChart2();
  } else if (e.value == "choice3") {
   this.clickChart3();
  } else if (e.value == "choice4") {
   this.clickChart4();
  }
 }

 ionViewDidEnter() {
  this.chartContainer = document.getElementById('chartContainer');
  this.clickChart1();
 }

}

