因为固体物理书上的球面投影图太难看,就自学 javascipt 用 echarts 做了个可交互的,效果如下:
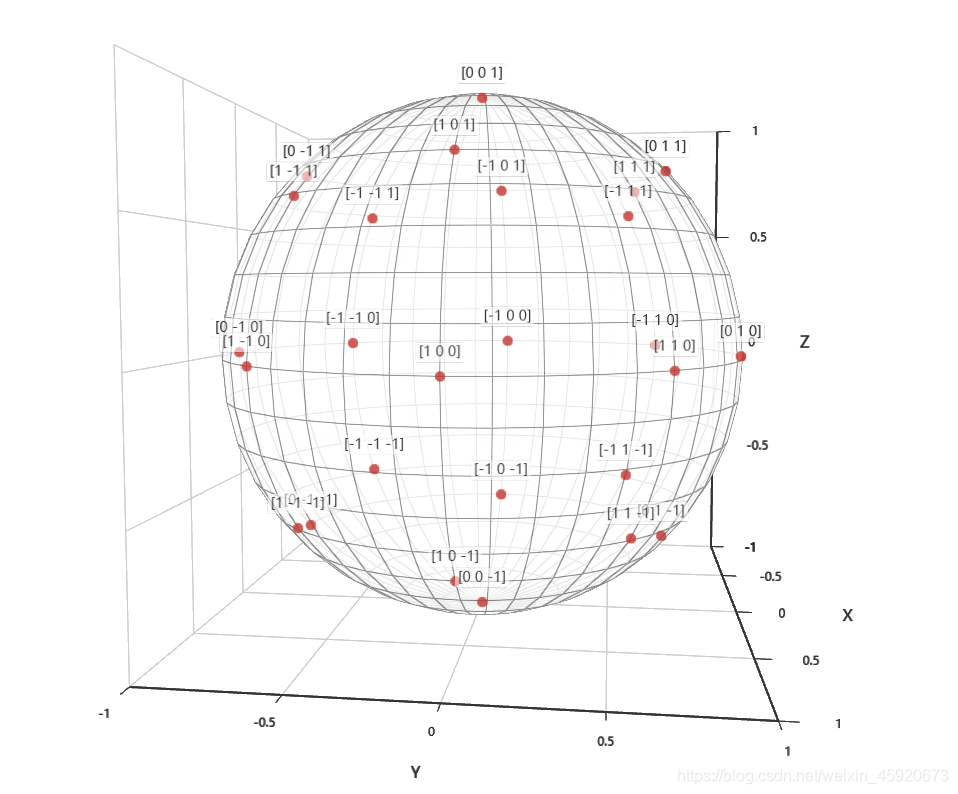

上面为立方晶系主要晶面(晶向)的球面投影,具体计算代码如下:
import math
import numpy as np

def c_scale(A):
 A = np.array(A)
 n_dim = A.shape[1]; n_size = A.shape[0]
 scale2 = np.zeros(n_size)
 for j in range(n_dim):
  for i in range(n_size):
   scale2[i] += A[i,j]**2
 scale = scale2 ** 0.5
 return scale

def normalize(A): # 二维数组归一化
 A = np.array(A)
 scale = c_scale(A)
 A = np.divide(A.T,scale).T
 return A

def cal_point_dict(input_str_list):
 points = []; points_dicts = []
 for input_str in input_str_list:
  input_str=input_str.replace('[',''); input_str=input_str.replace(']','')
  try:
   data = input_str.split(' ')
   point = [] # 求解投影点
   for j in range(len(data)):
    point.append(int(data[j]))
   points.append(point)
  except:
   data = input_str.split(',')
   point = [] # 求解投影点
   for j in range(len(data)):
    point.append(int(data[j]))
   points.append(point)
  points_p = normalize(points)
 for i in range(len(points_p)):
  points_dict={}
  points_dict['name']=input_str_list[i]
  points_dict['value']=points_p[i].tolist()
  points_dicts.append(points_dict)
 return points_dicts

# 各晶面指数
input_str_list = ['[0 0 1]','[1 0 0]','[0 1 0]','[0 0 -1]','[-1 0 0]','[0 -1 0]',
     '[1 0 1]','[0 1 1]','[1 1 0]','[-1 0 -1]','[0 -1 -1]','[-1 -1 0]',
     '[1 0 -1]','[0 1 -1]','[1 -1 0]','[-1 0 1]','[0 -1 1]','[-1 1 0]',
     '[1 1 1]','[-1 1 1]','[1 -1 1]','[1 1 -1]',
     '[-1 -1 -1]','[1 -1 -1]','[-1 1 -1]','[-1 -1 1]']
points_dicts = cal_point_dict(input_str_list)
points_dicts # 将该数据复制到 球坐标.html 下
绘图 html 源码:
<!DOCTYPE html>
<html style="height: 100%">
 <head>
  <meta charset="utf-8">
 </head>
 <body style="height: 100%; margin: 0">
  <div id="container" style="height: 100%"></div>
  <script type="text/javascript" src="https://cdn.jsdelivr.net/npm/echarts/dist/echarts.min.js"></script>
  <script type="text/javascript" src="https://cdn.jsdelivr.net/npm/echarts-gl/dist/echarts-gl.min.js"></script>
  <script type="text/javascript">
var dom = document.getElementById("container");
var myChart = echarts.init(dom);
var app = {};
option = null;

//var data = [{name:'[1 0 0]',value:[1,0,0]},{name:'[0 1 1]',value:[0,1,1]}];
var data1 =
[{'name': '[0 0 1]', 'value': [0.0, 0.0, 1.0]},
 {'name': '[1 0 0]', 'value': [1.0, 0.0, 0.0]},
 {'name': '[0 1 0]', 'value': [0.0, 1.0, 0.0]},
 {'name': '[0 0 -1]', 'value': [0.0, 0.0, -1.0]},
 {'name': '[-1 0 0]', 'value': [-1.0, 0.0, 0.0]},
 {'name': '[0 -1 0]', 'value': [0.0, -1.0, 0.0]},
 {'name': '[1 0 1]', 'value': [0.7071067811865475, 0.0, 0.7071067811865475]},
 {'name': '[0 1 1]', 'value': [0.0, 0.7071067811865475, 0.7071067811865475]},
 {'name': '[1 1 0]', 'value': [0.7071067811865475, 0.7071067811865475, 0.0]},
 {'name': '[-1 0 -1]',
 'value': [-0.7071067811865475, 0.0, -0.7071067811865475]},
 {'name': '[0 -1 -1]',
 'value': [0.0, -0.7071067811865475, -0.7071067811865475]},
 {'name': '[-1 -1 0]',
 'value': [-0.7071067811865475, -0.7071067811865475, 0.0]},
 {'name': '[1 0 -1]', 'value': [0.7071067811865475, 0.0, -0.7071067811865475]},
 {'name': '[0 1 -1]', 'value': [0.0, 0.7071067811865475, -0.7071067811865475]},
 {'name': '[1 -1 0]', 'value': [0.7071067811865475, -0.7071067811865475, 0.0]},
 {'name': '[-1 0 1]', 'value': [-0.7071067811865475, 0.0, 0.7071067811865475]},
 {'name': '[0 -1 1]', 'value': [0.0, -0.7071067811865475, 0.7071067811865475]},
 {'name': '[-1 1 0]', 'value': [-0.7071067811865475, 0.7071067811865475, 0.0]},
 {'name': '[1 1 1]',
 'value': [0.5773502691896258, 0.5773502691896258, 0.5773502691896258]},
 {'name': '[-1 1 1]',
 'value': [-0.5773502691896258, 0.5773502691896258, 0.5773502691896258]},
 {'name': '[1 -1 1]',
 'value': [0.5773502691896258, -0.5773502691896258, 0.5773502691896258]},
 {'name': '[1 1 -1]',
 'value': [0.5773502691896258, 0.5773502691896258, -0.5773502691896258]},
 {'name': '[-1 -1 -1]',
 'value': [-0.5773502691896258, -0.5773502691896258, -0.5773502691896258]},
 {'name': '[1 -1 -1]',
 'value': [0.5773502691896258, -0.5773502691896258, -0.5773502691896258]},
 {'name': '[-1 1 -1]',
 'value': [-0.5773502691896258, 0.5773502691896258, -0.5773502691896258]},
 {'name': '[-1 -1 1]',
 'value': [-0.5773502691896258, -0.5773502691896258, 0.5773502691896258]}]
 ;


var radius = 1;

option = {
 tooltip: {},
 xAxis3D: {},
 yAxis3D: {},
 zAxis3D: {},
 grid3D: {},
 animation: true,
 series: [{
  name: '参考球',
  type: 'surface',
  parametric: true,
  // shading: 'albedo',
  wireframe: {
   show: true
  },
  shading: 'color',
  itemStyle: {
   color: [1, 1, 1, 1],
   opacity: 0.8
  },

  parametricEquation: {
   u: {
    min: -Math.PI,
    max: Math.PI,
    step: Math.PI / 20
   },
   v: {
    min: 0,
    max: Math.PI,
    step: Math.PI / 20
   },
   x: function (u, v) {
    return radius * Math.sin(v) * Math.sin(u);
   },
   y: function (u, v) {
    return radius * Math.sin(v) * Math.cos(u);
   },
   z: function (u, v) {
    return radius * Math.cos(v);
   }
  }
 },
 {
  name: '球面投影点',
  type: 'scatter3D',
  blendMode: 'darken',
  showEffectOn: 'render',
  zlevel: 2,
  symbol : 'circle',
  label: {
   show: true,
   position: 'top',
   formatter: '{b}'},
  symbolSize: 10,
  data: data1
 }
 ]
};;
if (option && typeof option === "object") {
 myChart.setOption(option, true);
}
  </script>
 </body>
</html>
然而这样画出的图形还不能实现 3D 空间中的遮挡关系,要进一步实现可能还要借助 echarts 的地理坐标功能。
总结

