在交互环境中查看帮助文档:
import matplotlib.pyplot as plt
help(plt.plot)
以下是对帮助文档重要部分的翻译:
plot函数的一般的调用形式:
#单条线:
plot([x], y, [fmt], data=None, **kwargs)
#多条线一起画
plot([x], y, [fmt], [x2], y2, [fmt2], ..., **kwargs)
可选参数[fmt] 是一个字符串来定义图的基本属性如:颜色(color),点型(marker),线型(linestyle),
具体形式 fmt = '[color][marker][line]'
fmt接收的是每个属性的单个字母缩写,例如:
plot(x, y, 'bo-') # 蓝色圆点实线
若属性用的是全名则不能用*fmt*参数来组合赋值,应该用关键字参数对单个属性赋值如:
plot(x,y2,color='green', marker='o', linestyle='dashed', linewidth=1, markersize=6)

plot(x,y3,color='#900302',marker='+',linestyle='-')
常见的颜色参数:**Colors**
也可以对关键字参数color赋十六进制的RGB字符串如 color='#900302'
 ============= ===============================
 character  color
 ============= ===============================
 ``'b'``   blue 蓝
 ``'g'``   green 绿
 ``'r'``   red 红
 ``'c'``   cyan 蓝绿
 ``'m'``   magenta 洋红
 ``'y'``   yellow 黄
 ``'k'``   black 黑
 ``'w'``   white 白
 ============= ===============================
点型参数**Markers**,如:marker='+' 这个只有简写,英文描述不被识别
============= ===============================
 character  description
 ============= ===============================
 ``'.'``   point marker
 ``','``   pixel marker
 ``'o'``   circle marker
 ``'v'``   triangle_down marker
 ``'^'``   triangle_up marker
 ``'<'``   triangle_left marker
 ``'>'``   triangle_right marker
 ``'1'``   tri_down marker
 ``'2'``   tri_up marker
 ``'3'``   tri_left marker
 ``'4'``   tri_right marker
 ``'s'``   square marker
 ``'p'``   pentagon marker
 ``'*'``   star marker
 ``'h'``   hexagon1 marker
 ``'H'``   hexagon2 marker
 ``'+'``   plus marker
 ``'x'``   x marker
 ``'D'``   diamond marker
 ``'d'``   thin_diamond marker
 ``'|'``   vline marker
 ``'_'``   hline marker
 ============= ===============================
线型参数**Line Styles**,linestyle='-'
 ============= ===============================
 character  description
 ============= ===============================
 ``'-'``   solid line style 实线
 ``'--'``   dashed line style 虚线
 ``'-.'``   dash-dot line style 点画线
 ``':'``   dotted line style 点线
 ============= ===============================
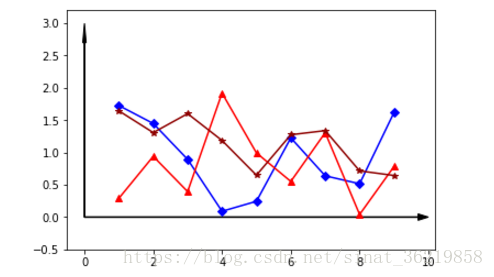
样例1
函数原型:matplotlib.pyplot.plot(*args, scalex=True, scaley=True, data=None, **kwargs)
>>> plot('xlabel', 'ylabel', data=obj)
解释:All indexable objects are supported. This could e.g. be a dict, a pandas.DataFame or a structured numpy array.
data 参数接受一个对象数据类型,所有可被索引的对象都支持,如 dict 等
import matplotlib.pyplot as plt
import numpy as np
'''read file
fin=open("para.txt")
a=[]
for i in fin:
 a.append(float(i.strip()))
a=np.array(a)
a=a.reshape(9,3)
'''
a=np.random.random((9,3))*2 #随机生成y

y1=a[0:,0]
y2=a[0:,1]
y3=a[0:,2]

x=np.arange(1,10)

ax = plt.subplot(111)
width=10
hight=3
ax.arrow(0,0,0,hight,width=0.01,head_width=0.1, head_length=0.3,length_includes_head=True,fc='k',ec='k')
ax.arrow(0,0,width,0,width=0.01,head_width=0.1, head_length=0.3,length_includes_head=True,fc='k',ec='k')

ax.axes.set_xlim(-0.5,width+0.2)
ax.axes.set_ylim(-0.5,hight+0.2)

plotdict = { 'dx': x, 'dy': y1 }
ax.plot('dx','dy','bD-',data=plotdict)

ax.plot(x,y2,'r^-')
ax.plot(x,y3,color='#900302',marker='*',linestyle='-')

plt.show()
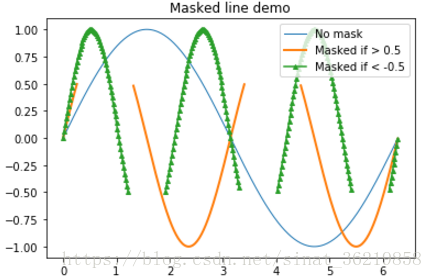
样例2,
import matplotlib.pyplot as plt
import numpy as np

x = np.arange(0, 2*np.pi, 0.02)
y = np.sin(x)
y1 = np.sin(2*x)
y2 = np.sin(3*x)
ym1 = np.ma.masked_where(y1 > 0.5, y1)
ym2 = np.ma.masked_where(y2 < -0.5, y2)

lines = plt.plot(x, y, x, ym1, x, ym2, 'o')
#设置线的属性
plt.setp(lines[0], linewidth=1)
plt.setp(lines[1], linewidth=2)
plt.setp(lines[2], linestyle='-',marker='^',markersize=4)
#线的标签
plt.legend(('No mask', 'Masked if > 0.5', 'Masked if < -0.5'), loc='upper right')
plt.title('Masked line demo')
plt.show()
例3 :圆
import numpy as np
import matplotlib.pyplot as plt

theta = np.arange(0, 2*np.pi, 0.01)
xx = [1,2,3,10,15,8]
yy = [1,-1,0,0,7,0]
rr = [7,7,3,6,9,9]

fig = plt.figure()
axes = flg.add_subplot(111)

i = 0
while i < len(xx):
 x = xx[i] + rr[i] *np.cos(theta)
 x = xx[i] + rr[i] *np.cos(theta)
 axes.plot(x,y)
 axes.plot(xx[i], yy[i], color='#900302', marker='*')
  i = i+1
width = 20
hight = 20
axes.arrow(0,0,0,hight,width=0.01,head_width=0.1,head_length=0.3,fc='k',ec='k')
axes.arrow(0,0,width,0,width=0.01,head_width=0.1,head_length=0.3,fc='k',ec='k')
plt.show()
到此这篇关于matplotlib.pyplot.plot()参数详解的文章就介绍到这了,更多相关matplotlib.pyplot.plot()内容请搜索以前的文章或继续浏览下面的相关文章希望大家以后多多支持!

