导言:
接上期,我们在极坐标下用python画了圆,心形线,玫瑰线,阿基米德螺线和双纽线5大常规曲线外,后来发现还漏了好一些漂亮且有意思的的曲线,今天就来讲一讲蝴蝶曲线。
蝴蝶曲线是平面上一类代数曲线,最初由美国南密西西比大学特普尔·费伊(Temple H·Fay)发现,因其形状宛如一只翩翩起舞的蝴蝶,故为其取美日“蝴蝶曲线”。
极坐标系下蝴蝶曲线方程为:

使用参数方程描述为:

有了蝴蝶曲线在极坐标下的曲线方程之后,我们就可以进行描点法画出其图形,先从最简单的蝴蝶曲线入手。
import matplotlib.pyplot as plt
import math

thetas =[] #用来存放极角
rhos = [] #用来存放极径

for i in range(-181, 181):
    theta = i*math.pi/180 #角度转弧度
    rho = math.exp(math.cos(theta)) - 2*math.cos(4*theta)+math.pow(math.sin(theta/12), 5) #极径
    thetas.append(theta)
    rhos.append(rho)

fig = plt.figure() #新建画布
plt.polar(thetas, rhos, color = "red") #极坐标画图
plt.title("butterfly")
plt.show()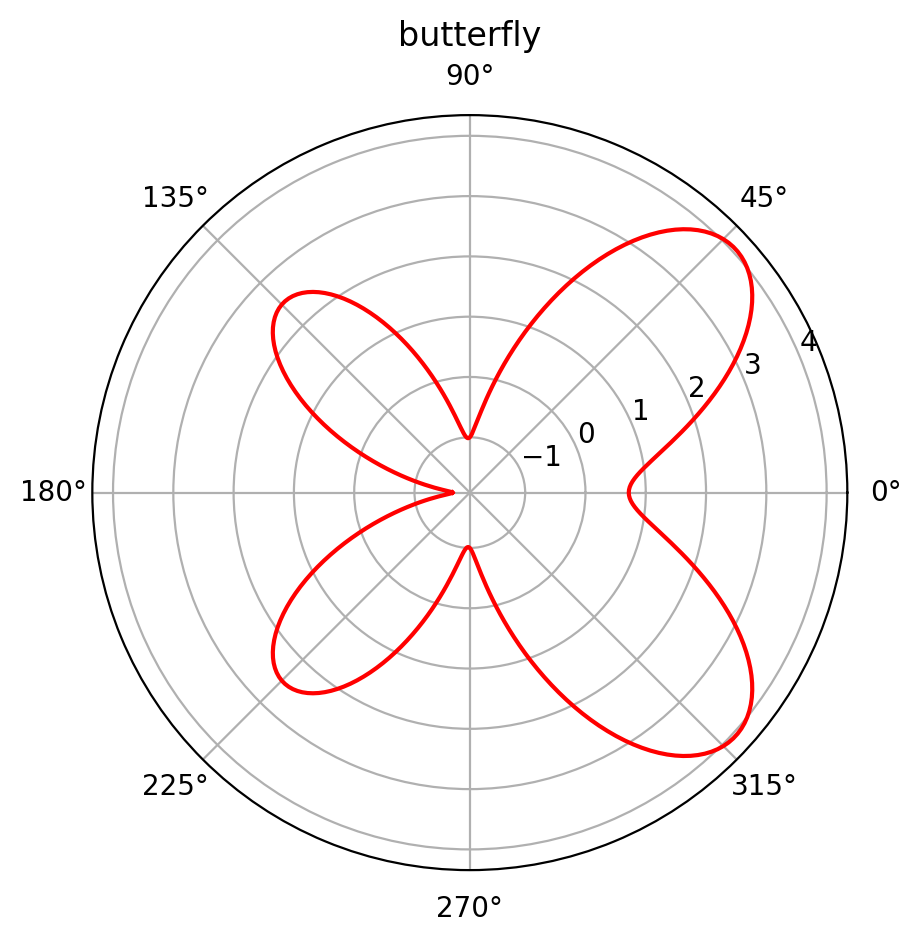
图1 蝴蝶曲线效果图
在上一部分我们画出了最简单的蝴蝶曲线,从效果图只能看到大致呈现蝴蝶形状,
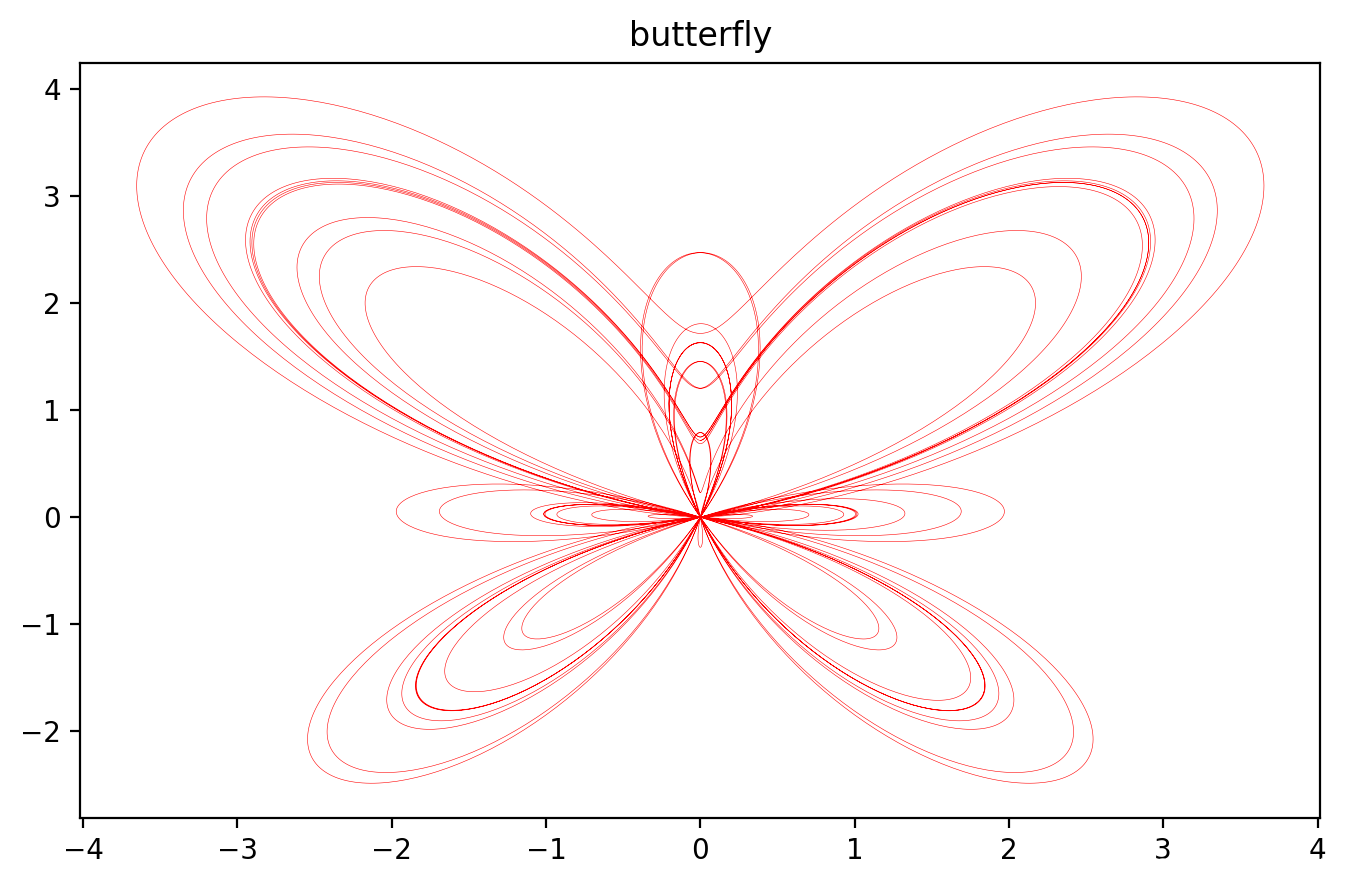
通过改变这个方程中的变量θ,可以得到不同形状与方向的蝴蝶曲线。如果再施以复杂的组合和变换,我们看到的就完全称得上是一幅艺术品了。
import matplotlib.pyplot as plt
import numpy as np
import math

X = []
Y = []
theta =0

for theta in np.linspace(0, math.pi*20, 10001):
    x = math.cos(theta)*(math.exp(math.cos(theta)) - 2*math.cos(4*theta) + math.pow(math.sin(theta/12),5))
    y = math.sin(theta)*(math.exp(math.cos(theta)) - 2*math.cos(4*theta) + math.pow(math.sin(theta/12),5))
    X.append(x)
    Y.append(y)

fig = plt.figure() #新建画布
plt.plot(Y, X, color = "red", linewidth = 0.2) #极坐标画图
plt.title("butterfly")
plt.show()
图2 优美蝴蝶曲线效果图
结论:
自然界的很多现象都可以适当的简化用代数曲线和超越曲线来表达,蝴蝶曲线只是其中一种,后续我们会探索更多有趣有意义的曲线图形。

