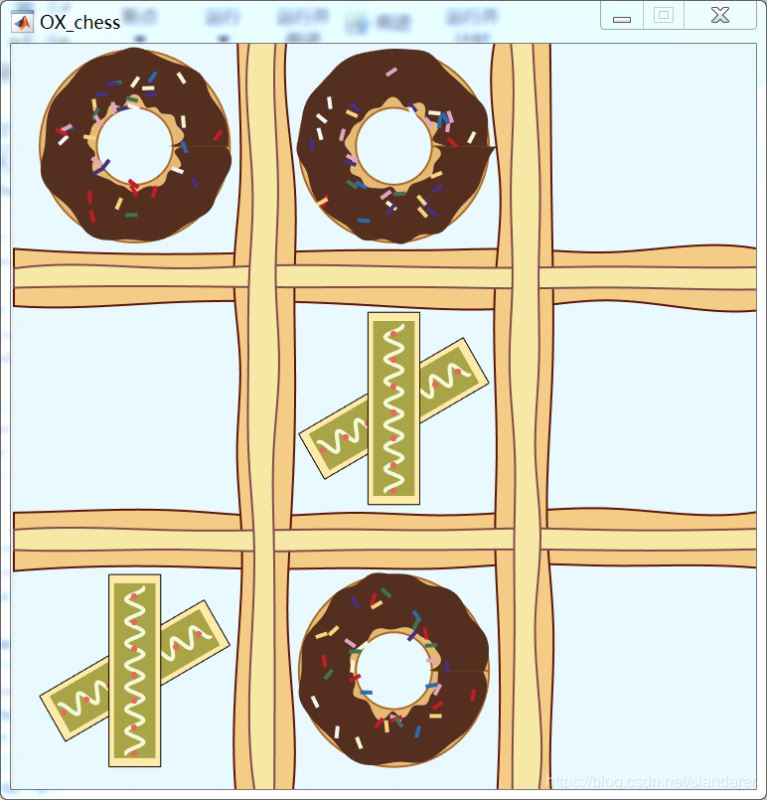
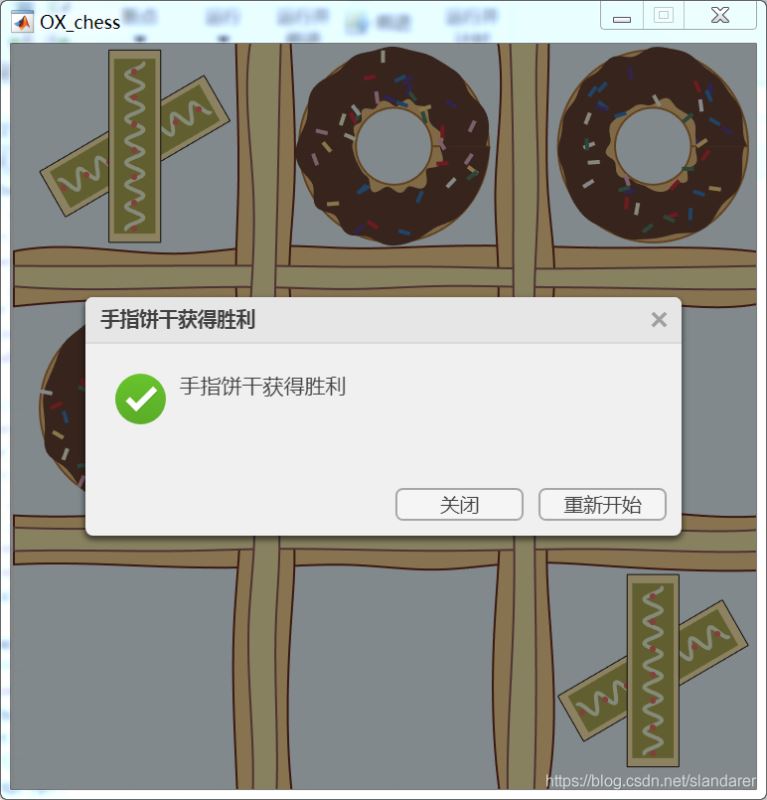
效果:
注: 由于用uifigure和uiaxes写的会比较慢,改成常规的axes和figure会快很多。
完整代码:
function OX_chess
fig=uifigure('units','pixels',...
        'position',[350 100 500 500],...
        'Numbertitle','off',...
        'name','OX_chess',...
        'Color',[1 1 1],...
        'resize','off',...
         'menubar','none');

ax=uiaxes('Units','pixels',...
        'parent',fig,...
        'Color',[0.9106 0.9773 1],...
        'Position',[-22 -20 540 540],...
        'XLim',[0-20 400+20],...
        'YLim',[0-20 400+20],...
        'XColor',[0.8706 0.9373 0.9686],...
        'YColor',[0.8706 0.9373 0.9686]);
ax.Toolbar.Visible='off';
hold(ax,'on')
drawCheckerboard()
%==========================================================================
set(fig,'WindowButtonDownFcn',@buttondown)
    function buttondown(~,~)
        xy=get(ax,'CurrentPoint');
        xp=xy(1,2);yp=xy(1,1);
        Pos=[xp,yp];
        Pos=round((Pos-50)./150)+1;
        if map(Pos(2),Pos(1))==0
            switch turn
                case 1,drawO(Pos(2),Pos(1)),turn=-1;map(Pos(2),Pos(1))=1;
                case -1,drawX(Pos(2),Pos(1)),turn=1;map(Pos(2),Pos(1))=-1;
            end
        end
        judge();
    end
    function judge(~,~)
        judge1=sum(map,1);
        judge2=sum(map,2);
        judge3=sum(map(eye(3)==1));
        judge4=sum(map([3,5,7]));
        winner=[];
        switch 1
            case any(judge1==3)||any(judge2==3)||judge3==3||judge4==3,winner='甜甜圈';
            case any(judge1==-3)||any(judge2==-3)||judge3==-3||judge4==-3,winner='手指饼干';
        end
        if ~isempty(winner)
            buttonName1=uiconfirm(fig,[winner,'获得胜利'],[winner,'获得胜利'],'Options',{'关闭','重新开始'},'Icon','success');
                if isempty(buttonName1),buttonName1='end';end
                if strcmp(buttonName1,'重新开始'),restart();
                elseif strcmp(buttonName1,'关闭');delete(fig);
                end
        end
    end

    function restart(~,~)
        turn=1;
        map=zeros(3,3);
        delete(findobj(ax,'type','patch'))
        delete(findobj(ax,'type','line'))
        delete(findobj(ax,'type','scatter'))
        drawCheckerboard()
    end
turn=1;
map=zeros(3,3);


%==========================================================================
    function drawX(i,j)
        x=50+150*(i-1);
        y=50+150*(j-1);
        Xb=[-55:1:+55,+55:-1:-55];
        Xs=[-50:1:+50,+50:-1:-50];
        Yb=[(-15).*ones(1,length(Xb)/2),(+15).*ones(1,length(Xb)/2)];
        Ys=[(-12).*ones(1,length(Xs)/2),(+12).*ones(1,length(Xs)/2)];
        Xsin=-48:0.1:48;
        Ysin=sin(Xsin./2).*5;
        Xp=-47:15:45;
        Yp=0.*ones(size(Xp));

        theta=pi/6;
        fill(ax,x+Xb.*cos(theta)-Yb.*sin(theta),y+Yb.*cos(theta)+Xb.*sin(theta),[1.0000    0.9216    0.6588]);
        fill(ax,x+Xs.*cos(theta)-Ys.*sin(theta),y+Ys.*cos(theta)+Xs.*sin(theta),[0.6627    0.6431    0.2745],'EdgeColor','none');
        plot(ax,x+Xsin.*cos(theta)-Ysin.*sin(theta),y+Ysin.*cos(theta)+Xsin.*sin(theta),'LineWidth',2,'Color',[0.9451    0.9843    0.8471])
        scatter(ax,x+Xp.*cos(theta)-Yp.*sin(theta),y+Yp.*cos(theta)+Xp.*sin(theta),10,'filled','CData',[0.9216    0.4000    0.3725])

        theta=3*pi/6;
        fill(ax,x+Xb.*cos(theta)-Yb.*sin(theta),y+Yb.*cos(theta)+Xb.*sin(theta),[1.0000    0.9216    0.6588]);
        fill(ax,x+Xs.*cos(theta)-Ys.*sin(theta),y+Ys.*cos(theta)+Xs.*sin(theta),[0.6627    0.6431    0.2745],'EdgeColor','none');
        plot(ax,x+Xsin.*cos(theta)-Ysin.*sin(theta),y+Ysin.*cos(theta)+Xsin.*sin(theta),'LineWidth',2,'Color',[0.9451    0.9843    0.8471])
        scatter(ax,x+Xp.*cos(theta)-Yp.*sin(theta),y+Yp.*cos(theta)+Xp.*sin(theta),10,'filled','CData',[0.9216    0.4000    0.3725])
    end


    function drawO(i,j)
        x=50+150*(i-1);
        y=50+150*(j-1);
        R=55;
        t=0:0.01:2*pi;
        XR=x+cos(t).*R;
        YR=y+sin(t).*R;
        Xr=x+cos(t).*R.*0.4;
        Yr=y+sin(t).*R.*0.4;
        fill(ax,[XR,Xr],[YR,Yr],[0.90 0.73 0.45],'EdgeColor',[0.67 0.42 0.15],'LineWidth',1)

        [t,rL,RL]=createRandomLine_O(R);
        T=[t,t(end:-1:1)];
        Rr=[RL,rL];
        X=x+cos(T).*Rr;
        Y=y+sin(T).*Rr;
        fill(ax,X,Y,[0.33 0.18 0.12],'EdgeColor','none')

        candiColor=[    0.9765    0.8353    0.4902
            0.9647    0.9647    0.8314
            0.1490    0.4235    0.6980
            0.2431    0.4510    0.3490
            0.9490    0.9647    0.9686
            0.7647    0.1059    0.1569
            0.2784    0.1843    0.5216
            0.8824    0.6471    0.7490];
        for i=1:35
            t1=rand(1)*2*pi;
            t2=rand(1)*2*pi;
            r1=(R*0.6-5).*rand(1)+R*0.4;
            x1=x+cos(t1)*r1;
            y1=y+sin(t1)*r1;
            x2=x1+cos(t2)*7;
            y2=y1+sin(t2)*7;
            plot(ax,[x1,x2],[y1,y2],'Color',candiColor(randi(size(candiColor,1)),:),'LineWidth',2);
        end
    end

    function [t,r,R]=createRandomLine_O(RR)
        t=0:0.2:2*pi;
        R=(RR-3)+5.*rand(size(t));
        R=interp1(t,R,0:0.01:2*pi,'spline');

        r=(RR*0.4+7)-6.*rand(size(t));
        r=interp1(t,r,0:0.01:2*pi,'spline');

        t=0:0.01:2*pi;
    end


    function drawCheckerboard
        [Xq,Yq]=createRandomLine_CB(440,10,5,26);
        fill(ax,Xq-20,Yq+112,[0.96 0.80 0.52],'EdgeColor',[0.45 0.11 0.05].*0.8,'LineWidth',1)
        [Xq,Yq]=createRandomLine_CB(440,10,5,26);
        fill(ax,Xq-20,Yq+262,[0.96 0.80 0.52],'EdgeColor',[0.45 0.11 0.05].*0.8,'LineWidth',1)
        [Xq,Yq]=createRandomLine_CB(440,10,5,26);
        fill(ax,Yq+112,Xq-20,[0.96 0.80 0.52],'EdgeColor',[0.45 0.11 0.05].*0.8,'LineWidth',1)
        [Xq,Yq]=createRandomLine_CB(440,10,5,26);
        fill(ax,Yq+262,Xq-20,[0.96 0.80 0.52],'EdgeColor',[0.45 0.11 0.05].*0.8,'LineWidth',1)

        [Xq,Yq]=createRandomLine_CB(440,10,2,10);
        fill(ax,Xq-20,Yq+120,[0.97 0.91 0.65],'EdgeColor',[0.5,0.3 0.3],'LineWidth',1)
        [Xq,Yq]=createRandomLine_CB(440,10,2,10);
        fill(ax,Xq-20,Yq+270,[0.97 0.91 0.65],'EdgeColor',[0.5,0.3 0.3],'LineWidth',1)
        [Xq,Yq]=createRandomLine_CB(440,10,5,10);
        fill(ax,Yq+120,Xq-20,[0.97 0.91 0.65],'EdgeColor',[0.5,0.3 0.3],'LineWidth',1)
        [Xq,Yq]=createRandomLine_CB(440,10,5,10);
        fill(ax,Yq+270,Xq-20,[0.97 0.91 0.65],'EdgeColor',[0.5,0.3 0.3],'LineWidth',1)
    end
    function [Xq,Yq]=createRandomLine_CB(Lim,N,randMax,h)
        X1=linspace(0,Lim,N);
        X2=X1(end:-1:1);
        Y1=-randMax.*rand(size(X1));
        Y2=randMax.*rand(size(X2));

        Xq1=0:0.1:Lim;
        Yq1=interp1(X1,Y1,Xq1,'spline');

        Xq2=Lim:-0.1:0;
        Yq2=interp1(X2,Y2,Xq2,'spline')+h;

        Xq=[Xq1,Xq2];
        Yq=[Yq1,Yq2];


    end
end

