最近写论文需要观察中间特征层的特征图,使用的是yolov5的代码仓库,但是苦于找不到很好的轮子,于是参考了很多,只找了这个,但是我觉得作者写的太复杂了(我之前就是这个作者的小粉丝),在参考了github的yolov5作者给出的issue建议后,自己写了个轮子,没有复杂的步骤,借助torchvision中的transforms将tensor转化为PIL,再通过matplotlib保存特图。希望能给大家带来一些帮助。
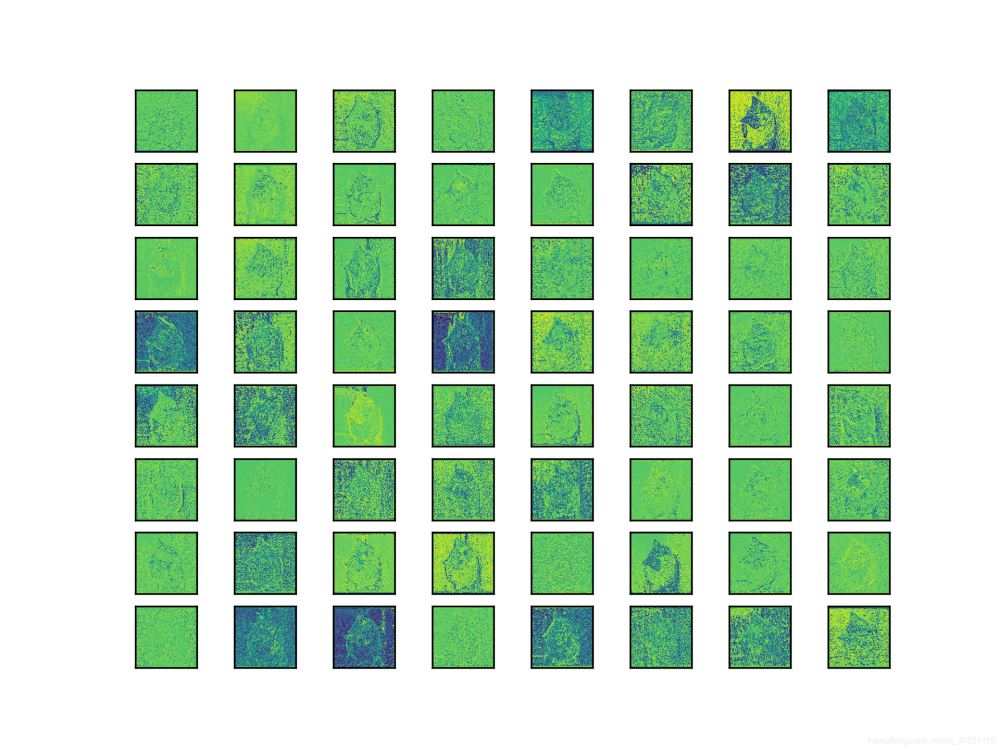
先上一下效果图,因为深层的特征有高达1024个,这里我只打印了8*8的特征图,用plt.subplot将64张特征图展示在一张图片上。原图为我在百度上随便搜的猫咪:

这是yolov5x.pt进行detect过程中,经过可视化后的第一个C3模块的前64张特征图:
这里也可以设置为灰度图,后续代码中会给出。
可以看到不同特征图所提取到的特征几乎都不相同,有的侧重边缘,有的则是侧重整体,当然这只是第一个C3的特征图,相对于更深层的特征来说,浅层的特征大多是完整的,而更深层的特征则会更小,而且是提取到的细小特征,当然,这些特征图也都是相互联系的,网络结构是个整体。
借助yolov5作者在issue里说到的:
BTW, a single feature map may be in my opinion a shallow set of information, as you are looking at a 2d spatial slice but are not aptly observing relationships across the feature space (as the convolutions do).
I guess an analogy is that you would be viewing the R, G, B layers of a color image by themselves, when it helps to view them together to get the complete picture.
单个特征图可能是一组浅层信息,因为你正在查看 2d 空间切片,但并未恰当地观察特征空间中的关系(如卷积所做的那样)。
这里是我自己的理解,通过特征图的可视化,也进一步的理解了卷积到底干了些什么事情,如果有想进一步交流的小伙伴,私信一起讨论,一起学习呀。
使用方法很简单,只需要在utils中的general.py或者plots.py添加如下函数:
import matplotlib.pyplot as plt
from torchvision import transforms

def feature_visualization(features, model_type, model_id, feature_num=64):
    """
    features: The feature map which you need to visualization
    model_type: The type of feature map
    model_id: The id of feature map
    feature_num: The amount of visualization you need
    save_dir = "features/"
    if not os.path.exists(save_dir):
        os.makedirs(save_dir)
    # print(features.shape)
    # block by channel dimension
    blocks = torch.chunk(features, features.shape[1], dim=1)
    # # size of feature
    # size = features.shape[2], features.shape[3]
    plt.figure()
    for i in range(feature_num):
        torch.squeeze(blocks[i])
        feature = transforms.ToPILImage()(blocks[i].squeeze())
        # print(feature)
        ax = plt.subplot(int(math.sqrt(feature_num)), int(math.sqrt(feature_num)), i+1)
        ax.set_xticks([])
        ax.set_yticks([])
        plt.imshow(feature)
        # gray feature
        # plt.imshow(feature, cmap='gray')
    # plt.show()
    plt.savefig(save_dir + '{}_{}_feature_map_{}.png'
                .format(model_type.split('.')[2], model_id, feature_num), dpi=300)
接着在models中的yolo.py中的这个地方:
def forward_once(self, x, profile=False):
        y, dt = [], []  # outputs
        for m in self.model:
            if m.f != -1:  # if not from previous layer
                x = y[m.f] if isinstance(m.f, int) else [x if j == -1 else y[j] for j in m.f]  # from earlier layers

            if profile:
                o = thop.profile(m, inputs=(x,), verbose=False)[0] / 1E9 * 2 if thop else 0  # FLOPS
                t = time_synchronized()
                for _ in range(10):
                    _ = m(x)
                dt.append((time_synchronized() - t) * 100)
                print('%10.1f%10.0f%10.1fms %-40s' % (o, m.np, dt[-1], m.type))
            x = m(x)  # run
            y.append(x if m.i in self.save else None)  # save output
            # add in here
        if profile:
            print('%.1fms total' % sum(dt))
        return x
添加如下代码:
            feature_vis = True
            if m.type == 'models.common.C3' and feature_vis:
                print(m.type, m.i)
                feature_visualization(x, m.type, m.i)
添加在yolo.py后,无论是在detect.py还是在train.py中都会进行可视化特征图。
然而训练的过程中并不一定需要一直可视化特征图,feature_vis参数是用来控制是否保存可视化特征图的,保存的特征图会存在features文件夹中。如果想看其它层的特征只需要修改m.type或是用m.i来进行判断是否可视化特征图。m.type对应的是yaml文件中的module,即yolov5的基础模块,例如c3,conv,spp等等,而m.i则更好理解,即是模块的id,通常就是顺序,如果你尝试修改过配置文件,那么你肯定知道是什么。
如果不明白,多使用print函数,用list.len()和tensor.size去查看列表长度和张量维度,打印出来你就知道了。
这里有一个点我很迷惑,不知道有没有大佬可以告诉我原因,就是我并没有找到yolo.py和detect.py之间的关联,detect.py中使用的是:
model = attempt_load(weights, map_location=device)
而并没有使用yolo.py中的Model函数,但是运行detect.py同样可以可视化特征图,不是很懂pytorch代码中的这个机制,希望有大佬可以指教一下,代码还是有些菜。
注意1:在yolo.py的开头import feature_visualization:
from utils.general import feature_visualization
注意2:yolov5无论是在detect还是在train的过程中,都会先对模型进行Summary,即验证你的模型的层数,参数以及是否有梯度,这个过程也会保存特征图,但是不要担心,因为你保存的特征图名字是相同的,会被覆盖,如果你打印的出来log就会看到整个模型跑了两次:
Model Summary: 476 layers, 87730285 parameters, 0 gradients
注意3:建议训练完成的网络使用detect.py来进行验证特征图。
当然在yolo.py里面也可以将'__main__'中的 :
model = Model(opt.cfg).to(device)
替换为:
model = attempt_load(opt.weights, map_location=device)
同样可以跑通(把detect.py中的opt.weights复制过来)。在yolo.py中打开Profile,将随机生成的图片换成自己的图片,就可以正常的进行验证。
周末摸鱼时间写了这个(也不算摸鱼,下周该写论文初稿了orz),希望给大家带来帮助,如果有疑问或者错误,在评论区或者私信联系我,之后我会把这个提交一个pr到yolov5的官方仓库里(之前提交了一个visdrone.yaml的配置文件,幸被采用了,参考的就是这个作者的代码,感谢!),就到这里,最后上一个spp结构的特征图输出,希望和大家一起讨论。
以上。


