用法:
Axes.fill_between(x, y1, y2=0, where=None, interpolate=False, step=None, *, data=None, **kwargs)
参数说明:

import matplotlib.pyplot as plt
import numpy as np
x = [1, 2, 3, 4, 5]
y1 = [1, 4, 9, 16, 25]
y2 = [9, 9, 9, 9, 9]
fig, (ax1, ax2) = plt.subplots(1,2)
ax1.fill_between(x, y1, alpha=.5, linewidth=0)
ax1.set_title('填充x,y1之间')
ax2.fill_between(x, y2, alpha=.5, linewidth=1)
ax2.set_title('填充x,y2之间')
plt.show()
当然这样时没有多大意义的,只是想展示出一个比较明确的填充,类似于区域全部填充颜色
import matplotlib.pyplot as plt
import numpy as np

np.random.seed(1)
x = np.linspace(0, 8, 16)
y1 = 3 + 4*x/8 + np.random.uniform(0.0, 0.5, len(x))
y2 = 1 + 2*x/8 + np.random.uniform(0.0, 0.5, len(x))
fig, ax = plt.subplots()
ax.fill_between(x, y1, y2, alpha=.5, linewidth=0)
ax.plot(x, (y1 + y2)/2, linewidth=2)

ax.set(xlim=(0, 8), xticks=np.arange(1, 8),
       ylim=(0, 8), yticks=np.arange(1, 8))
plt.show()
import numpy as np
import matplotlib.pyplot as plt

Nsteps, Nwalkers = 100, 250
t = np.arange(Nsteps)
# an (Nsteps x Nwalkers) array of random walk steps
S1 = 0.004 + 0.02*np.random.randn(Nsteps, Nwalkers)
S2 = 0.002 + 0.01*np.random.randn(Nsteps, Nwalkers)
# an (Nsteps x Nwalkers) array of random walker positions
X1 = S1.cumsum(axis=0)
X2 = S2.cumsum(axis=0)
# Nsteps length arrays empirical means and standard deviations of both
# populations over time
mu1 = X1.mean(axis=1)
sigma1 = X1.std(axis=1)
mu2 = X2.mean(axis=1)
sigma2 = X2.std(axis=1)
# plot it!
fig, ax = plt.subplots(1)
ax.plot(t, mu1, lw=2, label='mean population 1')
ax.plot(t, mu2, lw=2, label='mean population 2')
ax.fill_between(t, mu1+sigma1, mu1-sigma1, facecolor='C0', alpha=0.4)
ax.fill_between(t, mu2+sigma2, mu2-sigma2, facecolor='C1', alpha=0.4)
ax.set_title(r'random walkers empirical $\mu$ and $\pm \sigma$ interval')
ax.legend(loc='upper left')
ax.set_xlabel('num steps')
ax.set_ylabel('position')
ax.grid()
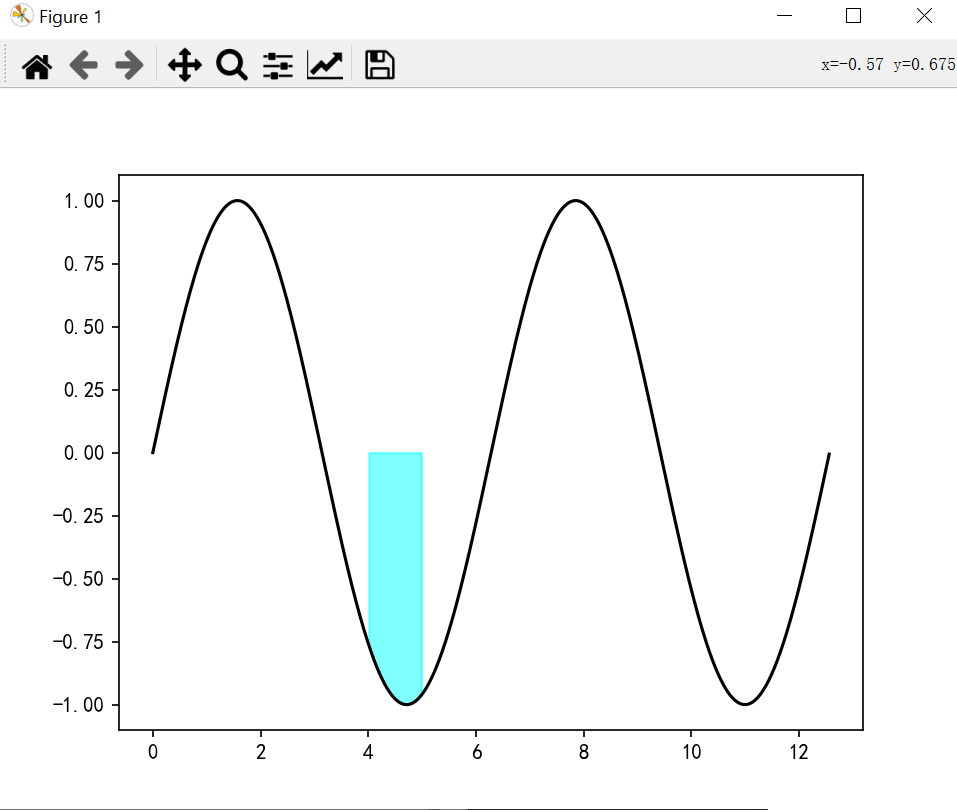
定义从何处排除要填充的某些水平区域。填充区域由坐标x[其中]定义。更准确地说,如果其中[i]和其中[i+1],则在x[i]和x[i+1]之间填充。请注意,此定义意味着where中两个假值之间的孤立真值不会导致填充。由于相邻的假值,真实位置的两侧仍保持未填充状态。
import numpy as np
import matplotlib.pyplot as plt

fig, ax = plt.subplots()
x = np.arange(0, 4 * np.pi, 0.01)
y = np.sin(x)
ax.plot(x, y, color='black')
ax.fill_between(x, y, 0, where=(x>4)&(x<5),color='cyan', alpha=0.5)
plt.show()
在语义上,where通常用于y1>y2或类似的词。默认情况下,定义填充区域的多边形节点将仅放置在x阵列中的位置。这样的多边形无法描述上述靠近交点的语义。包含交叉点的x截面仅被剪裁。
将“插值”设置为True将计算实际交点,并将填充区域延伸到此点。
import numpy as np
import matplotlib.pyplot as plt

x = np.array([0, 1, 2, 3])
y1 = np.array([0.8, 0.8, 0.2, 0.2])
y2 = np.array([0, 0, 1, 1])

fig, (ax1, ax2) = plt.subplots(2, 1, sharex=True)
ax1.set_title('interpolation=False')
ax1.plot(x, y1, 'o--')
ax1.plot(x, y2, 'o--')
ax1.fill_between(x, y1, y2, where=(y1 > y2), color='C0', alpha=0.3)
ax1.fill_between(x, y1, y2, where=(y1 < y2), color='C1', alpha=0.3)
ax2.set_title('interpolation=True')
ax2.plot(x, y1, 'o--')
ax2.plot(x, y2, 'o--')
ax2.fill_between(x, y1, y2, where=(y1 > y2), color='C0', alpha=0.3,
                 interpolate=True)
ax2.fill_between(x, y1, y2, where=(y1 <= y2), color='C1', alpha=0.3,                interpolate=True)
fig.tight_layout()
包含参数为三个{‘pre’,‘post’,‘mid’}
如果填充应为阶跃函数,即x之间的常数,则定义阶跃。该值确定阶跃发生的位置:
import numpy as np
import matplotlib.pyplot as plt

a = np.linspace(0,2*3.14,50)
b = np.sin(a)
plt.figsize=((12,6))
plt.subplot(131)
plt.fill_between(a, b, 0, where = (a > 2) & (a < 5), color = 'green', step='pre')
plt.plot(a,b)
plt.title('step=pre')

plt.subplot(132)
plt.fill_between(a, b, 0, where = (a > 2) & (a < 5), color = 'cyan', step='post')
plt.plot(a,b)
plt.title('step=post')

plt.subplot(133)
plt.fill_between(a, b, 0, where = (a > 2) & (a < 5), color = 'red', step='mid')
plt.plot(a,b)
plt.title('step=mid')
plt.show()
偏移会有点不一样,因为函数的缘故,偏移不太明显

