在处理csv文件时,会有些数据需要分组展示。
为了避免重复劳动,
# coding=UTF-8
from pyecharts import Bar,Scatter,Line
from pyecharts import Page
import pandas as pd
# 生成的HTML文件在程序目录 render.html
def create_line(x_data, line_data_head, line_data, line_dict):
# 建立一个Line图返回
# x_data X 轴数据
# bar_data_head 数据列
# bar_data 数据数组二维,数量和数据列匹配, 组内数据和 X轴数据匹配
# bar_dict 字典 , 标题, 副标题 , 长 , 宽
line = Line(line_dict['title'], line_dict['subtitle'], width=line_dict['width'], height=line_dict['height'])
for i in range(len(line_data_head)):
line.add(line_data_head[i], x_data, line_data[i], xaxis_interval=0, is_smooth=True)
return line
def lines_show(line_data):
# 显示多个曲线图
page = Page()
for b in line_data:
line = create_line(b['x'], b['head'], b['data'], b['dict'])
page.add(line)
page.render()
def create_bar(x_data, bar_data_head, bar_data, bar_dict):
# 建立一个Bar图返回
# x_data X 轴数据
# bar_data_head 数据列
# bar_data 数据数组二维,数量和数据列匹配, 组内数据和 X轴数据匹配
# bar_dict 字典 , 标题, 副标题 , 长 , 宽
bar = Bar(bar_dict['title'], bar_dict['subtitle'], width=bar_dict['width'], height=bar_dict['height'])
for i in range(len(bar_data_head)):
bar.add(bar_data_head[i], x_data, bar_data[i], xaxis_interval=0)
return bar
def bars_show(bar_data):
# 显示多个柱状图
page = Page()
for b in bar_data:
bar = create_bar(b['x'], b['head'], b['data'], b['dict'])
page.add(bar)
page.render()
def csv_data_show(csv_file, x_head_key, data_key, m_yw):
# 读取CSV 文件,获取多列数据,显示相关图示
df = pd.read_csv(csv_file, sep=',', encoding='gb2312')
cols_len = len(df.columns)
rows_len = len(df)
x_head = [str(c).strip() for c in df[x_head_key]]
print '数据列', cols_len, '数据行', rows_len, 'X轴数据', len(x_head), '图数', len(data_key)
yw_list = []
for m_data in data_key:
m_list = []
m_list_head = []
for i in m_data:
di = [d for d in df[df.columns[i]]]
m_list.append(di)
m_list_head.append(df.columns[i])
yw_i = {
'x': x_head,
'head': m_list_head,
'data': m_list,
'dict': m_yw
}
yw_list.append(yw_i)
bars_show(yw_list)
# lines_show(yw_list)
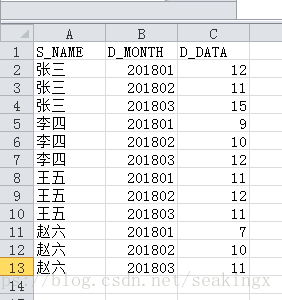
def csv_data_show_comb(csv_file, x_head_key, comb_key, data_key, m_yw):
# 读取CSV 文件,获取单列数据,分组显示显示相关图示
# x_head_key X轴数据列
# comb_key 分组数据列
# data_key 显示数据列
df = pd.read_csv(csv_file, sep=',', encoding='gb2312')
cols_len = len(df.columns)
rows_len = len(df)
m_comb = list(set([c for c in df[comb_key]]))
m_xhead = [str(d).strip() for d in df[(df[comb_key] == m_comb[0])][x_head_key]]
print '数据列', cols_len, '数据行', rows_len, 'X坐标数据', len(m_xhead)
yw_list = []
m_list = []
m_list_head = []
for i in range(len(m_comb)):
di = [d for d in df[(df[comb_key] == m_comb[i])][data_key]]
m_list.append(di)
m_list_head.append(str(m_comb[i]))
yw_i = {
'x': m_xhead,
'head': m_list_head,
'data': m_list,
'dict': m_yw
}
yw_list.append(yw_i)
bars_show(yw_list)
# lines_show(yw_list)
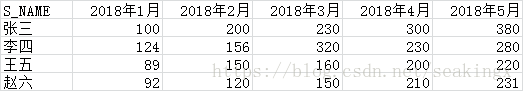
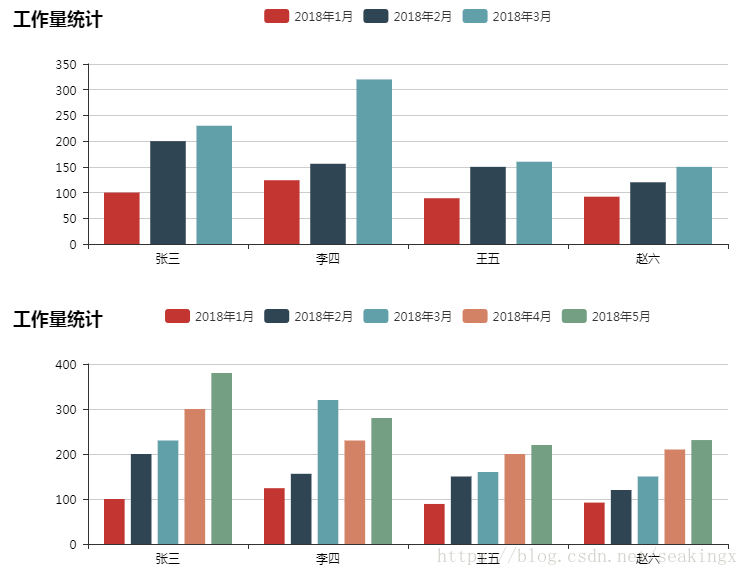
def an_data1():
# 画2张图 : 第一季度 及 1-5月
m_data_list = [[1,2,3],[1,2,3,4,5]]
m_yw = {
'title': '工作量统计',
'subtitle': '',
'width': 800,
'height': 300
}
csv_data_show(r'mt_data.csv', 'S_NAME', m_data_list, m_yw)
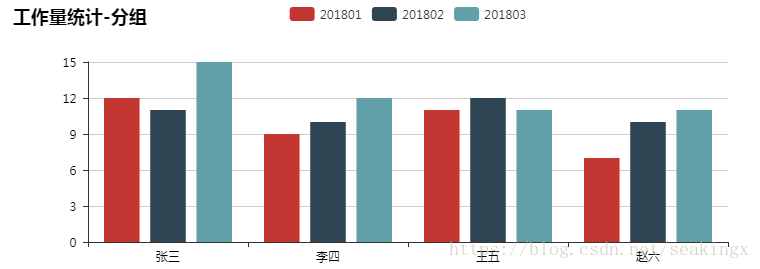
def an_data2():
m_yw = {
'title': '工作量统计-分组',
'subtitle': '',
'width': 800,
'height': 300
}
csv_data_show_comb(r'mc_data.csv', 'S_NAME', 'D_MONTH', 'D_DATA', m_yw)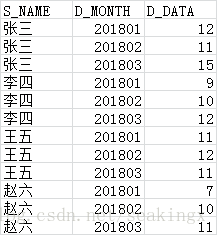
以上为个人经验,希望能给大家一个参考,也希望大家多多支持。

